Ethereum’s price has been on the rise for quite a while now after breaking above the $1300 resistance level. While the positive trend remains on higher timeframes, some signs are suggesting that at least a short-term correction is quite probable.
Technical Analysis
By: Edris
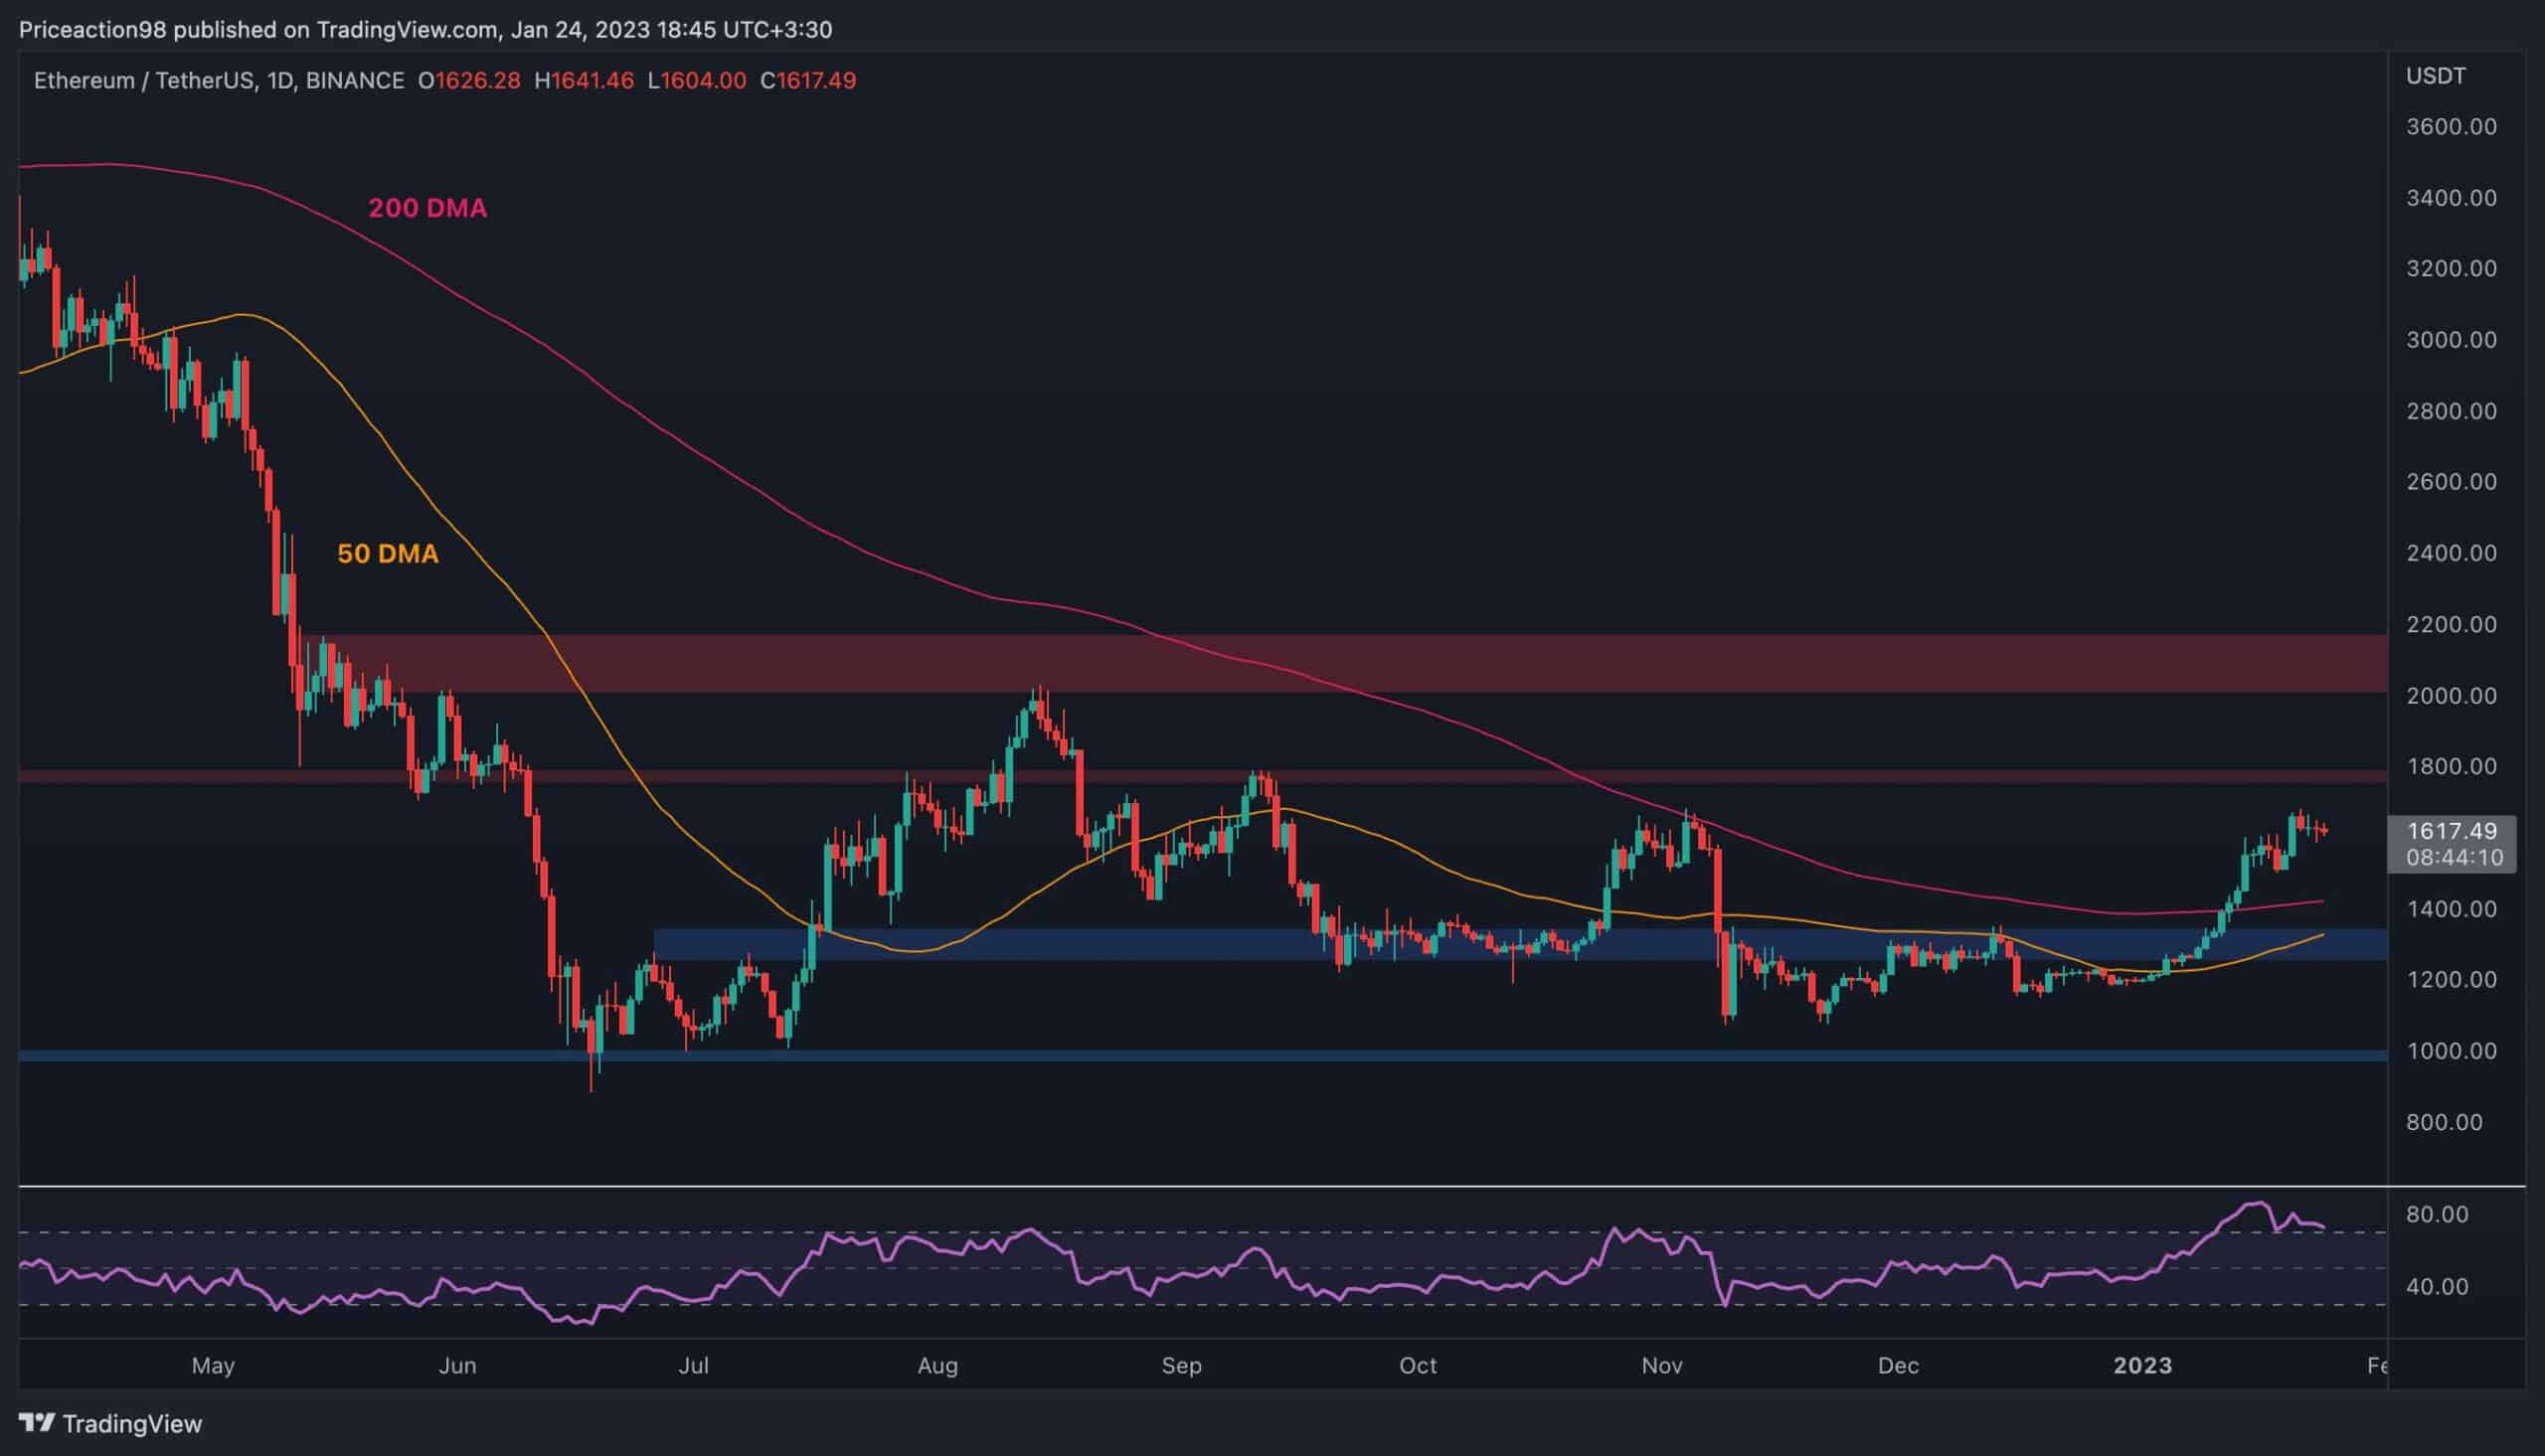
The Daily Chart
On the daily timeframe, the price is constantly climbing higher and could reach the $1800 level soon. However, a short-term pullback seems imminent as the RSI indicator has been in overbought conditions over the past few days.
In case of a correction, the 200-day moving average located around the $1400 mark could be the first turning point, with the 50-day moving average located around the $1300 support zone being the second major support. Still, the price could first test the $1800 level before a pullback or reversal.
In the less probable event of a bullish breakout from the $1800 resistance level on the first try, ETH could rally towards the significant $2000 level aggressively.
Overall, this scenario seems unlikely in the short term, as a pullback seems a lot more possible.
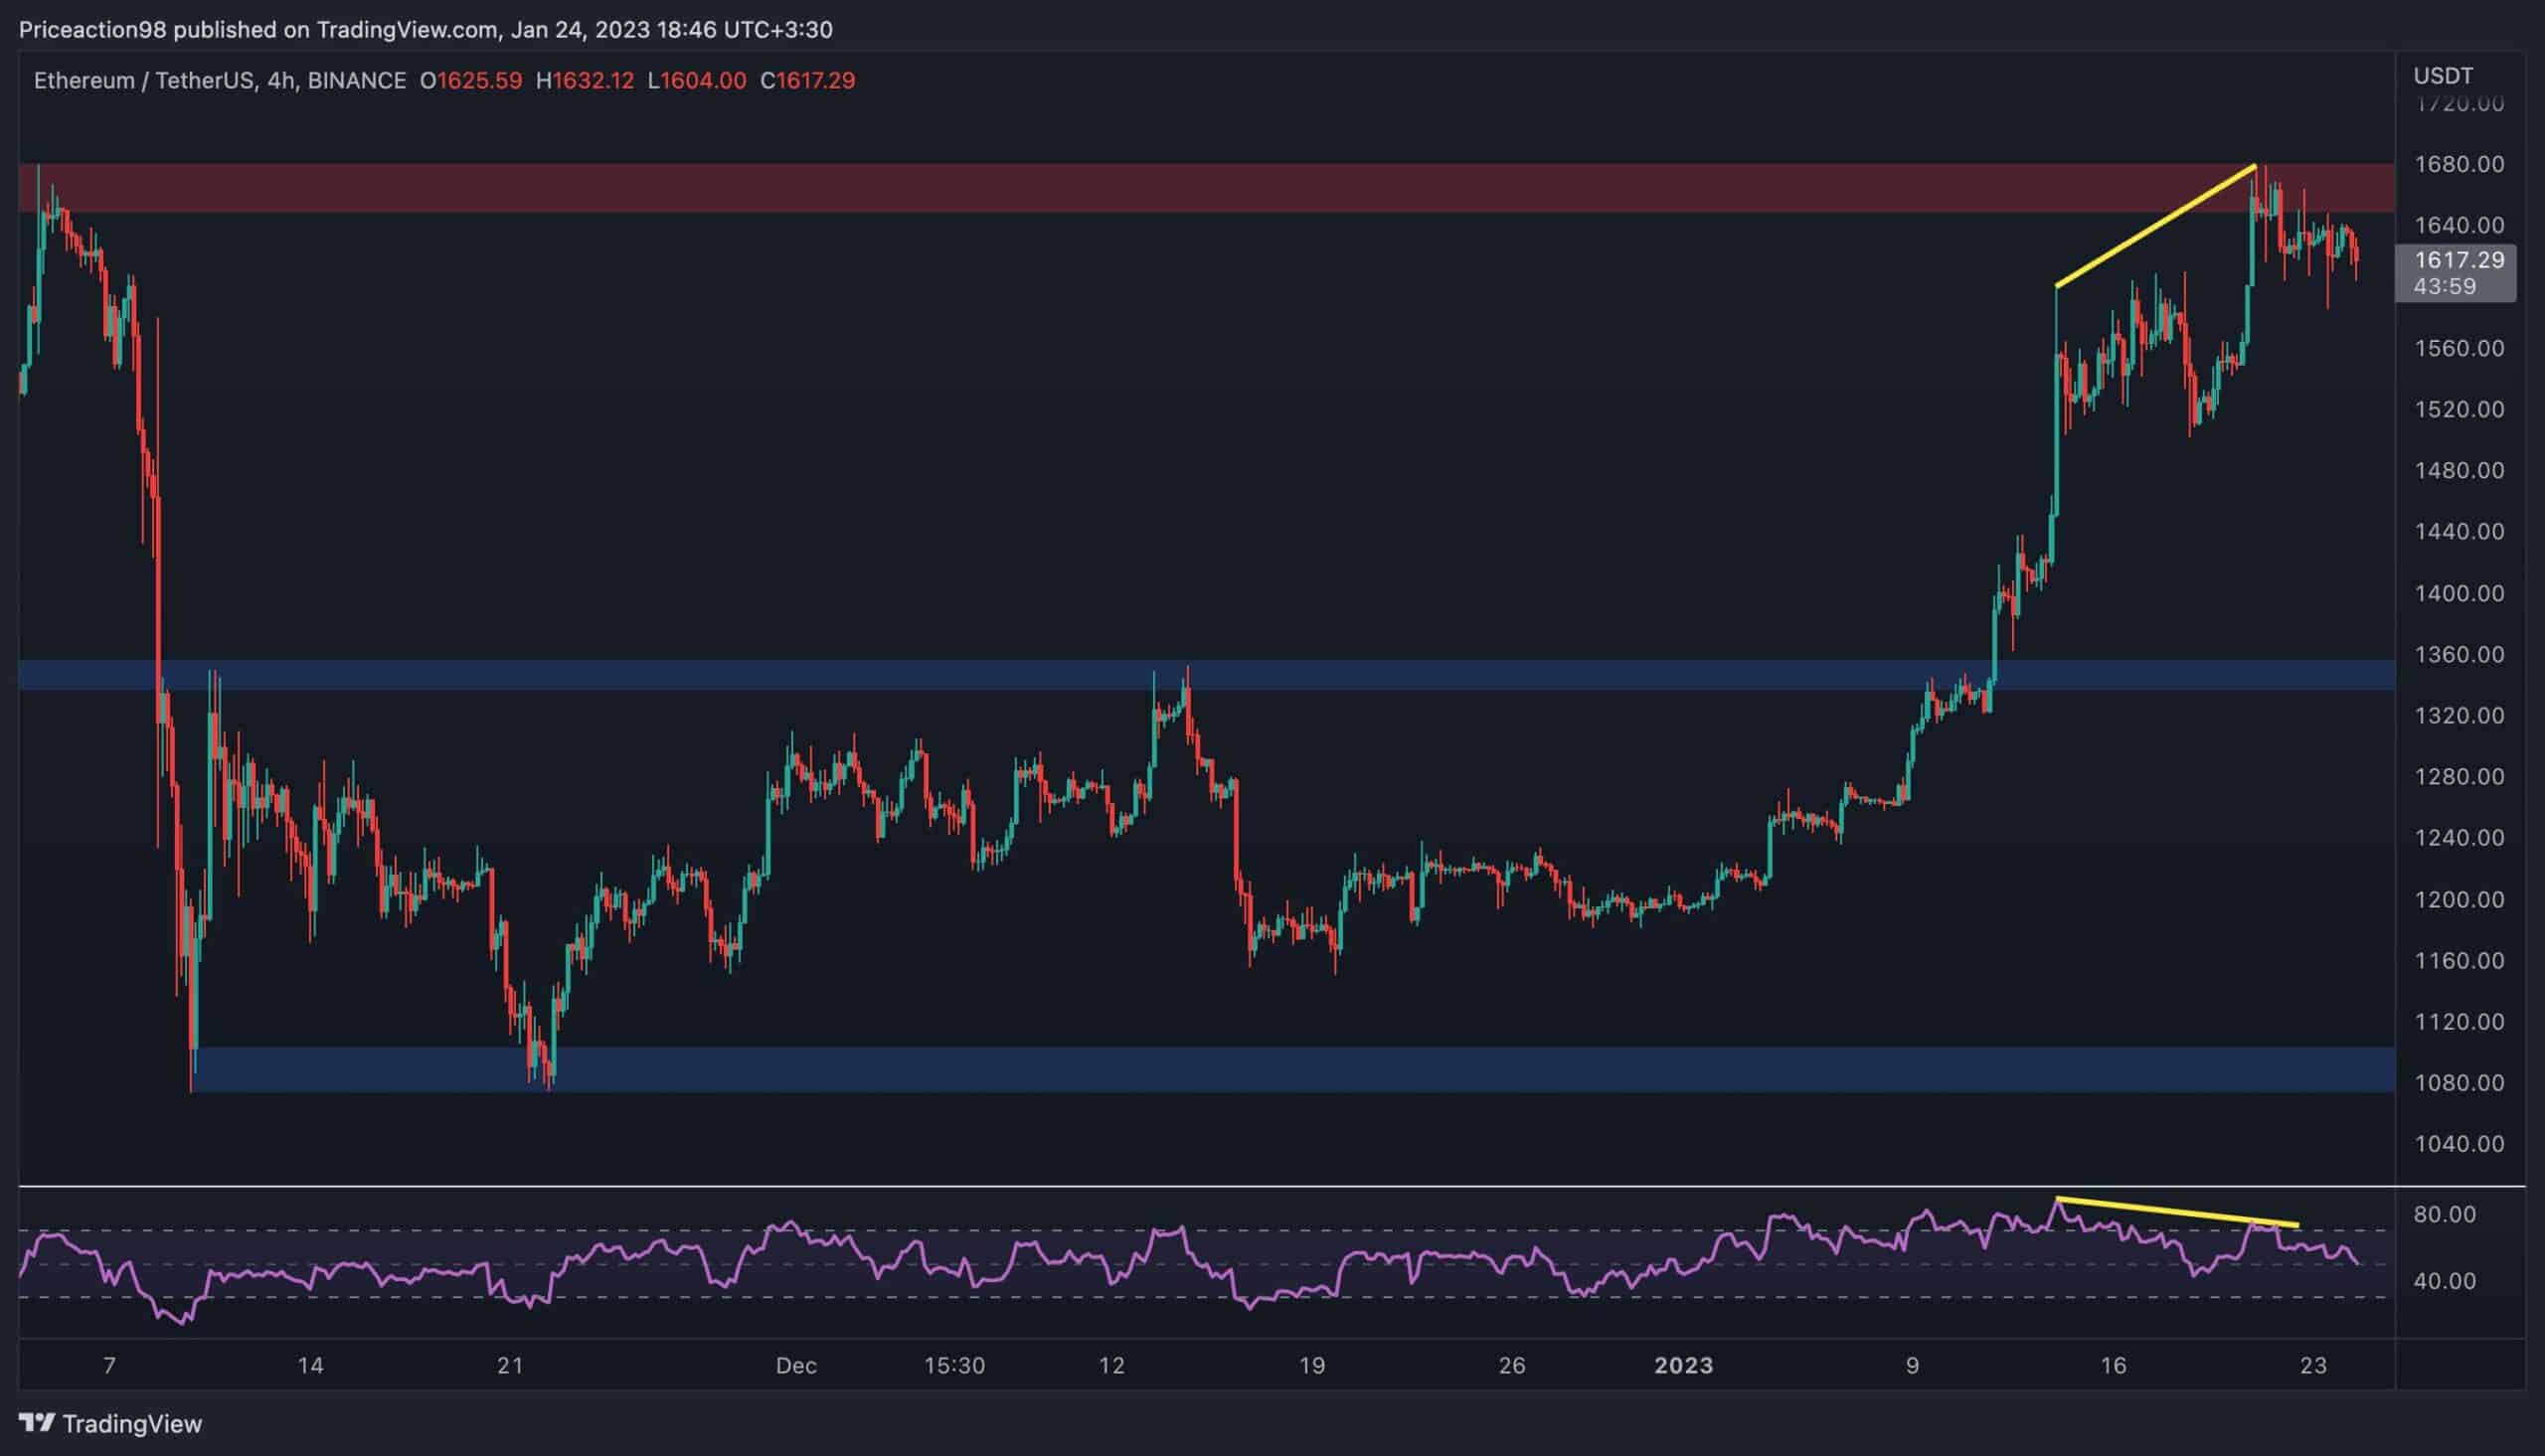
The 4-Hour Chart
Looking at the 4-hour timeframe, the price has reached the $1650 resistance area but is struggling to break higher at the moment.
The RSI indicator is also showing some worrying signs in this timeframe, as a clear bearish divergence has been forming between the last two price highs, with the RSI demonstrating a lower high. This classic reversal pattern could point to a probable rejection from the $1800 level in the short term.
From a classical price action consideration, the $1350 support area could continue holding in case of a deep correction. A valid breakout above the $1800 level would invalidate this scenario, but it does not seem very likely at the moment.
Sentiment Analysis
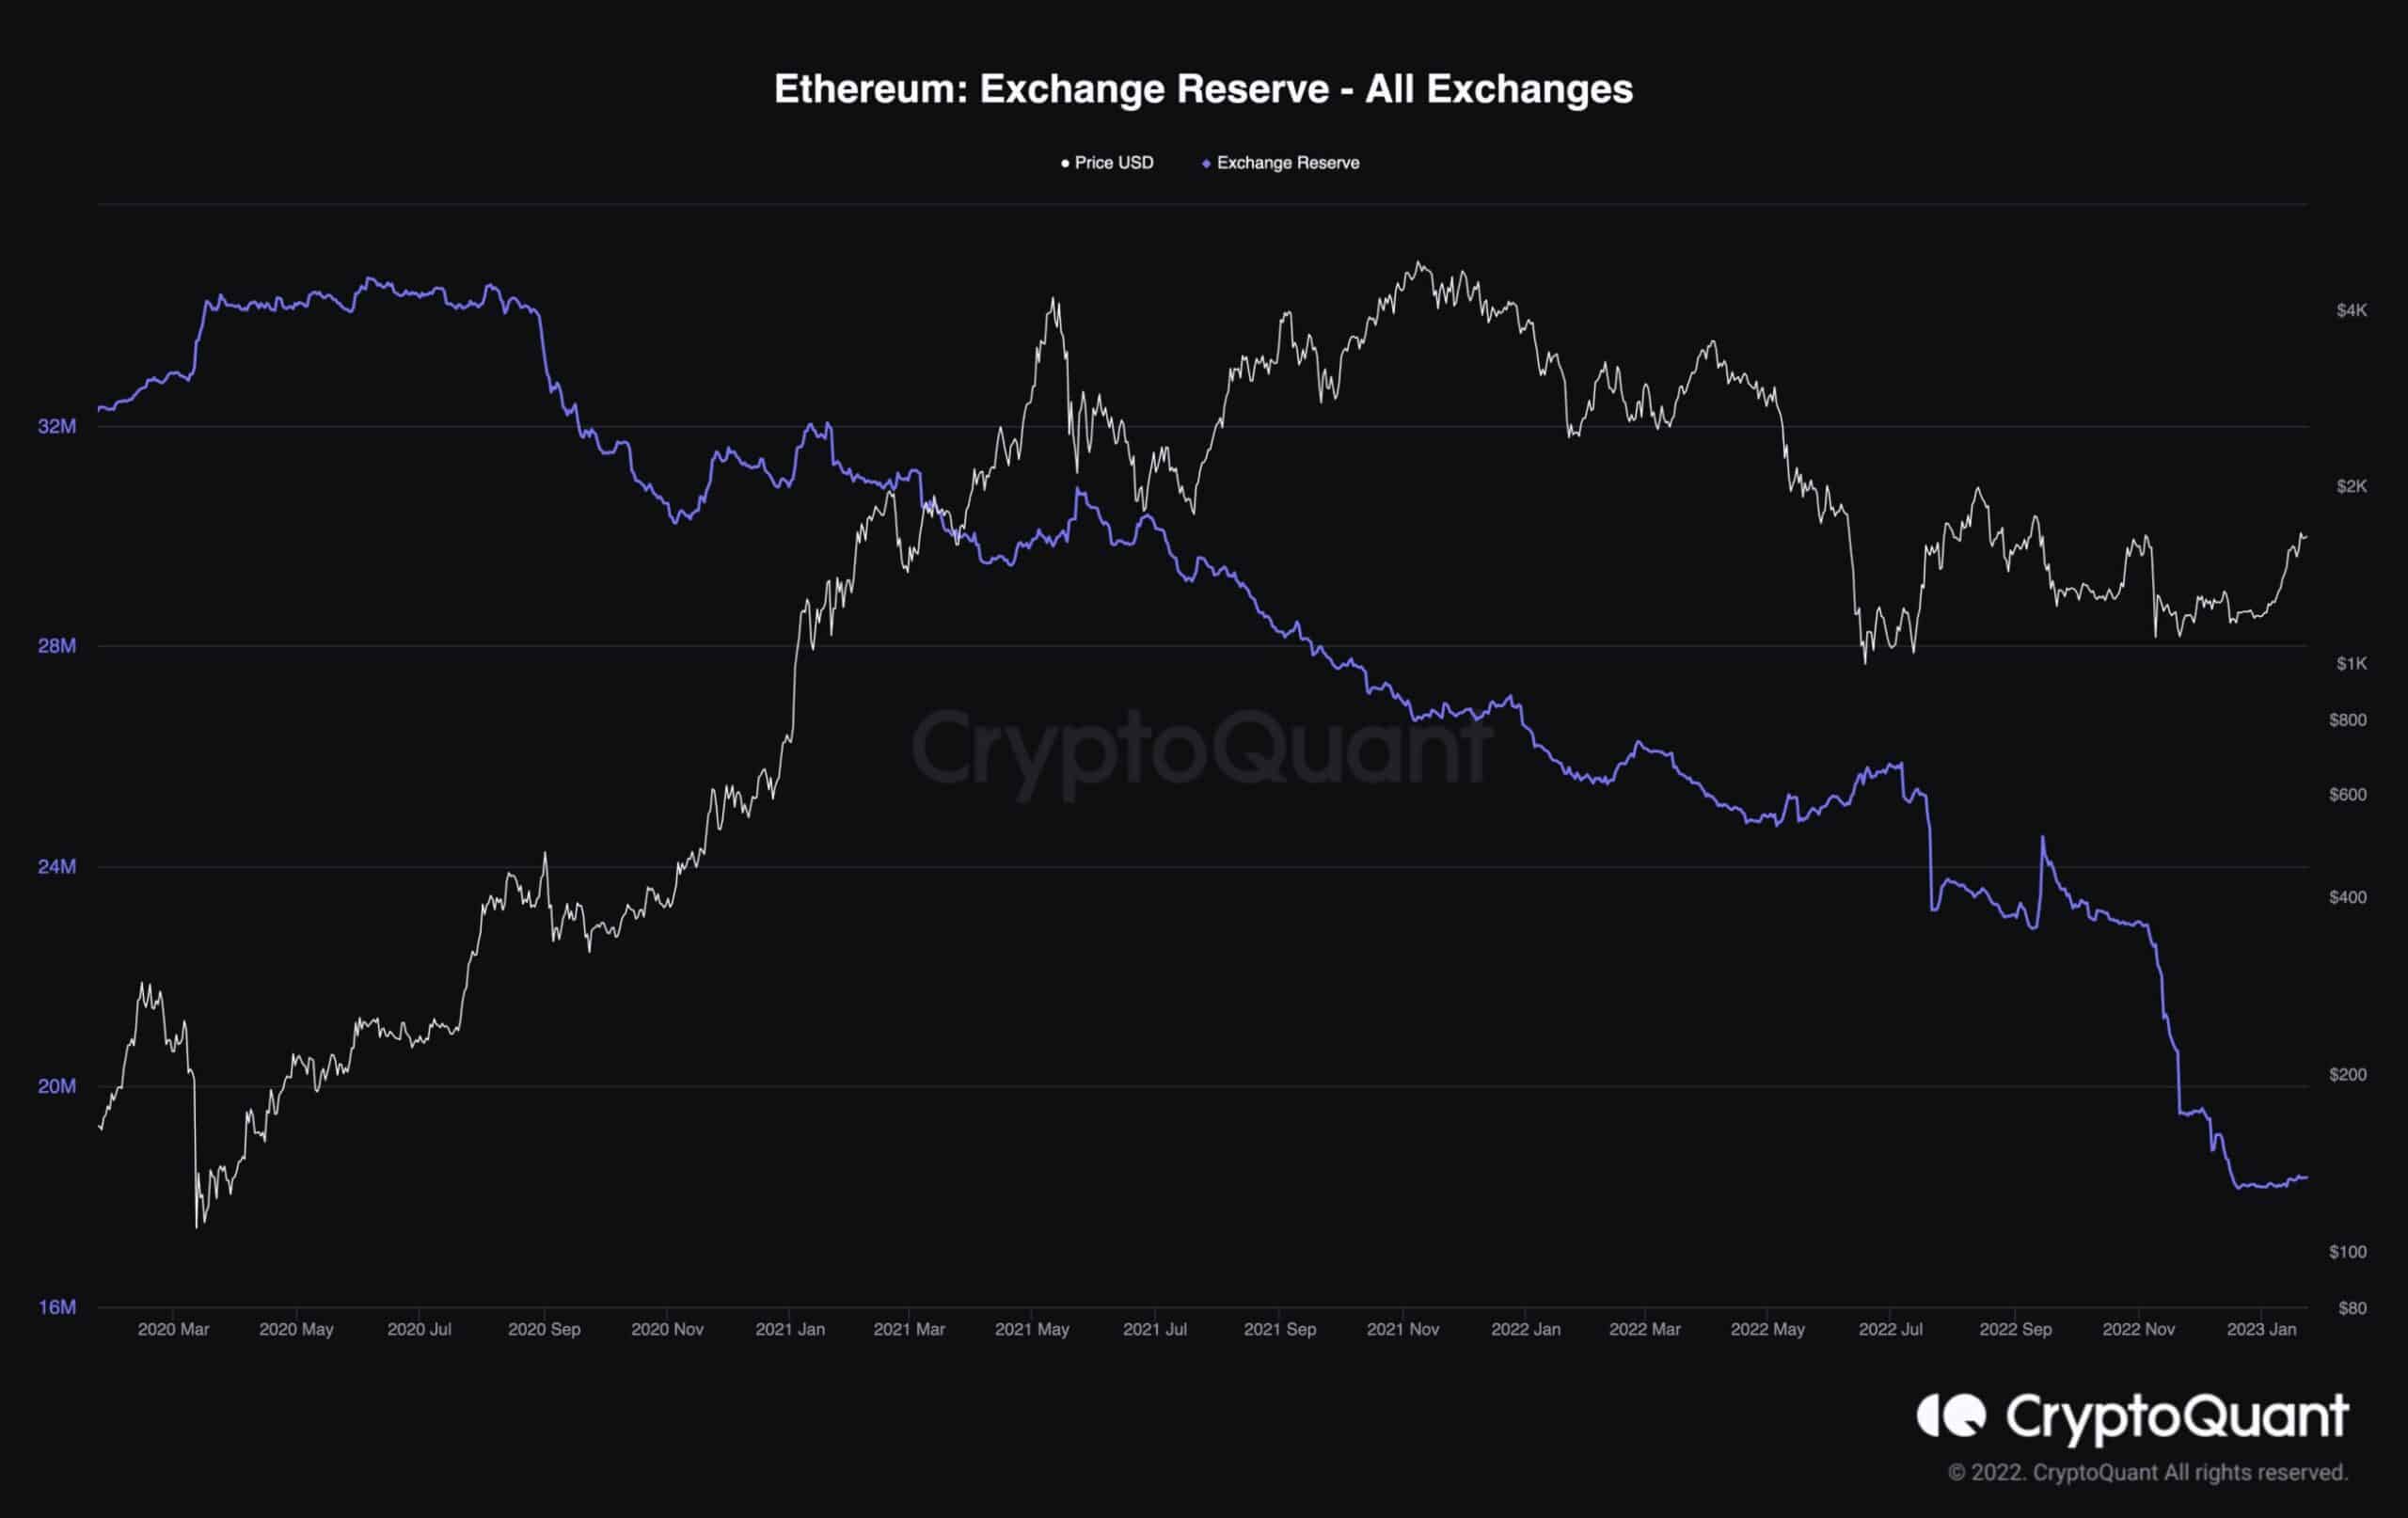
ETH Open Interest
Ethereum’s price has been on the rise over the last couple of weeks after an exhausting consolidation above the $1000 mark. Meanwhile, the exchange reserve metric’s decline has come to a halt after a massive drop since the FTX bankruptcy.
It is likely that the recent rally is a result of the significant decrease in exchange reserve, as many investors have withdrawn their coins from exchanges and stored them in their personal wallets, fearing that the same thing that happened to FTX could happen to their preferred exchange. Therefore, the subsequent supply shock could be one of the key factors leading to the current price rally.
However, the Exchange Reserve metric has currently stopped falling, which is pointing to the fact that while many holders are withdrawing ETH, others are depositing their coins to sell them at a profit or a smaller loss, as the price has risen relatively higher.
To conclude, this metric should be monitored closely in the short term as an increase in the reserve could lead to a surge in selling pressure, resulting in a bearish reversal.
Binance Free $100 (Exclusive): Use this link to register and receive $100 free and 10% off fees on Binance Futures first month (terms).
PrimeXBT Special Offer: Use this link to register & enter POTATO50 code to receive up to $7,000 on your deposits.
Disclaimer: Information found on CryptoPotato is those of writers quoted. It does not represent the opinions of CryptoPotato on whether to buy, sell, or hold any investments. You are advised to conduct your own research before making any investment decisions. Use provided information at your own risk. See Disclaimer for more information.
Cryptocurrency charts by TradingView.
Source: https://cryptopotato.com/eth-breaks-past-1-6k-but-is-a-short-term-correction-imminent-ethereum-price-analysis/