
Bulls are slowing down, as seen from the global market cap, which has dropped slightly. The global market cap stood at $2.52T as of press time, representing a 1% decrease over the last 24 hours while the trading volume dropped by 15.23% over the same period.
Ethereum Price Review
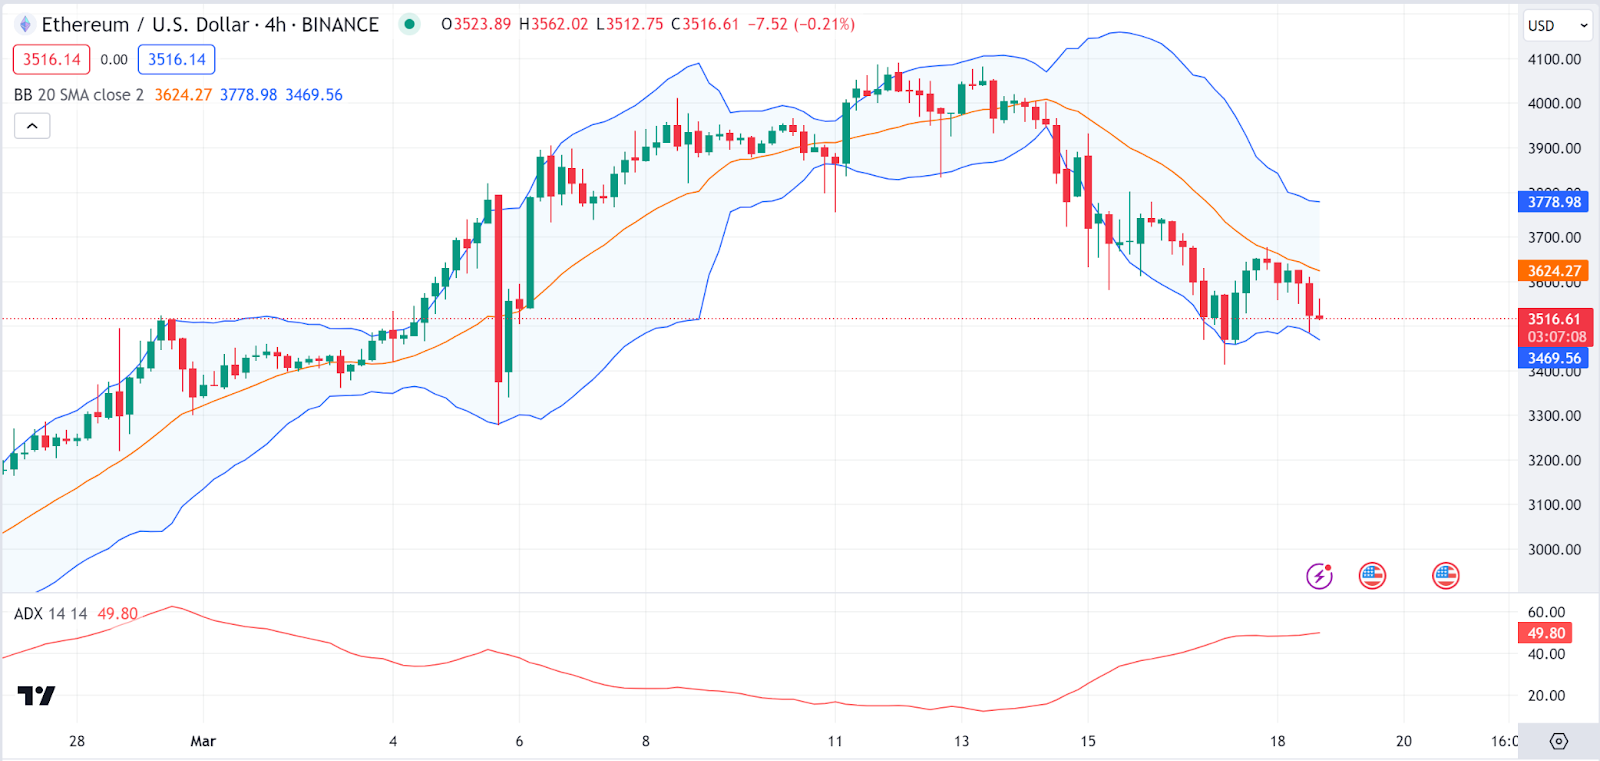
Ethereum (ETH), the altcoin king, has fallen prey to the bear sentiment as it failed to post gains. Ethereum charts show a downtrend as the Ethereum price consistently makes lower lows and lower highs.
The Bollinger Bands show that the Ethereum price trades near the lower band, suggesting that *ETH* is in a low volatility zone and possibly oversold. The Average Directional Index (ADX) is above 25, typically indicating a strong trend. The Ethereum price stood at $3,550 as of press time representing a 1.4% drop over the last 24 hours.
Aptos Price Review
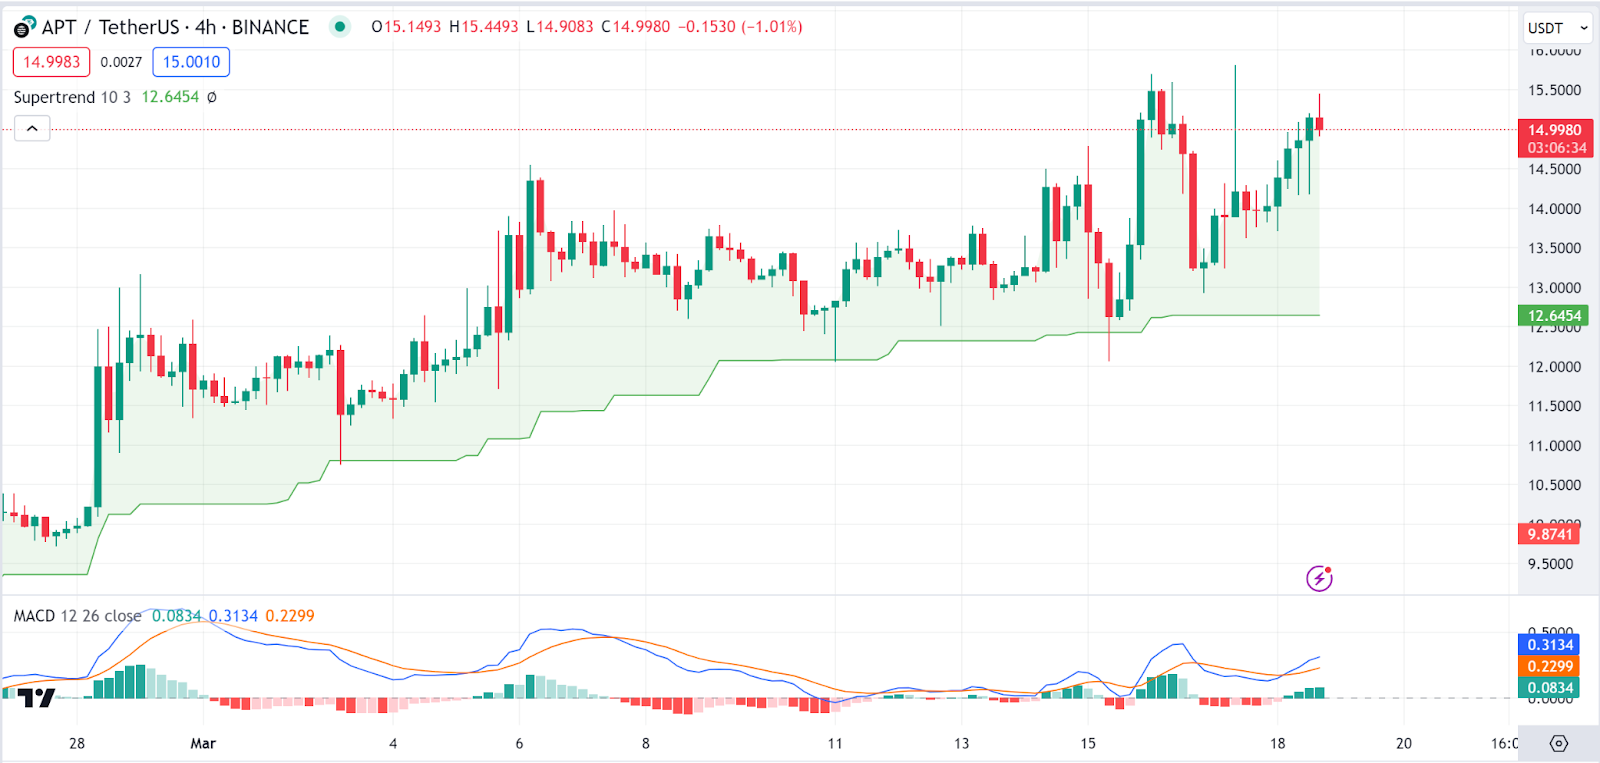
Aptos (APT) has however managed to post gains despite the downtrend. The Aptos price oscillates without a clear trend direction, trading sideways. The SuperTrend indicator is below the Aptos price, typically considered bullish. However, the flat movement of the price suggests consolidation rather than a trend.
The Moving Average Convergence Divergence (MACD) shows the signal line and the MACD line very close together and above the histogram, which may indicate a potential for either direction but lacks strong momentum. The Aptos price stood at $14.77 as of press time representing a 6.4% pump over the last 24 hours.
Avalanche Price Review
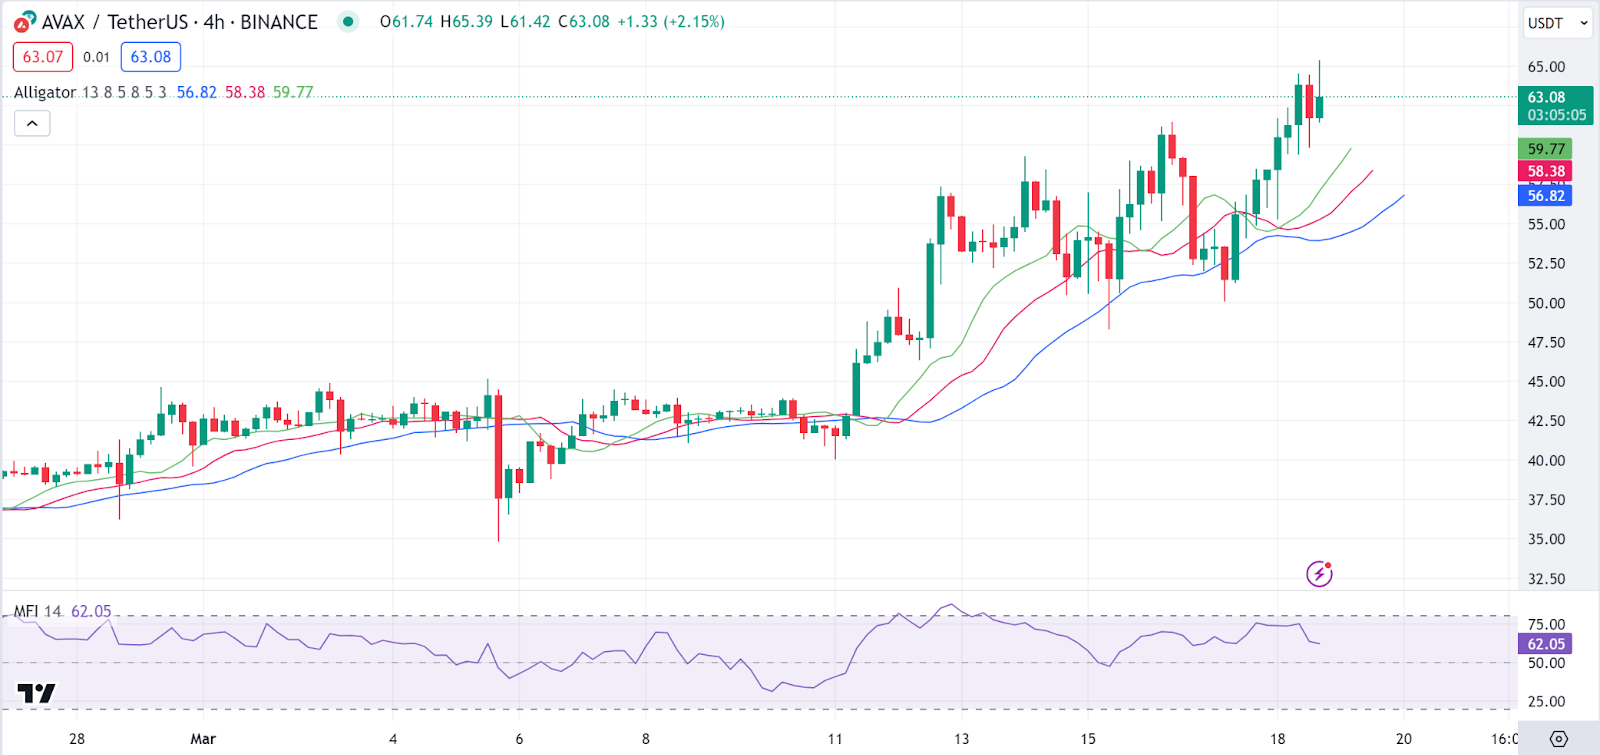
Avalanche (AVAX), is another coin that has managed to post gains today despite the trend. AVAX shows a more bullish picture with a general uptrend indicated by higher highs and higher lows.
The Avalanche price is above the Alligator indicator, indicating a potential uptrend. The Money Flow Index (MFI) is above 50 but not overbought, which could indicate that there’s still room for the Avalanche price to go up before hitting overbought conditions. The Avalanche price stood at $62 as of press time representing a 12.31% pump over the last 24 hours.
Shiba Inu Price Review
Despite showing resilience earlier, *SHIB* is now facing corrections amid the adverse conditions. The Pitchfork tool indicates that SHIB is currently in a downtrend channel. This suggests that SHIB is under selling pressure.
The Shiba Inu price is near the middle of the pitchfork, indicating that it’s in the middle of its current trend range. The Awesome Oscillator (AO) is below zero and showing red bars, suggesting bearish momentum. The Shiba Inu price stood at $0.00002662 as of press time representing a drop of 8.3% over the last 24 hours.

Jupiter Price Review
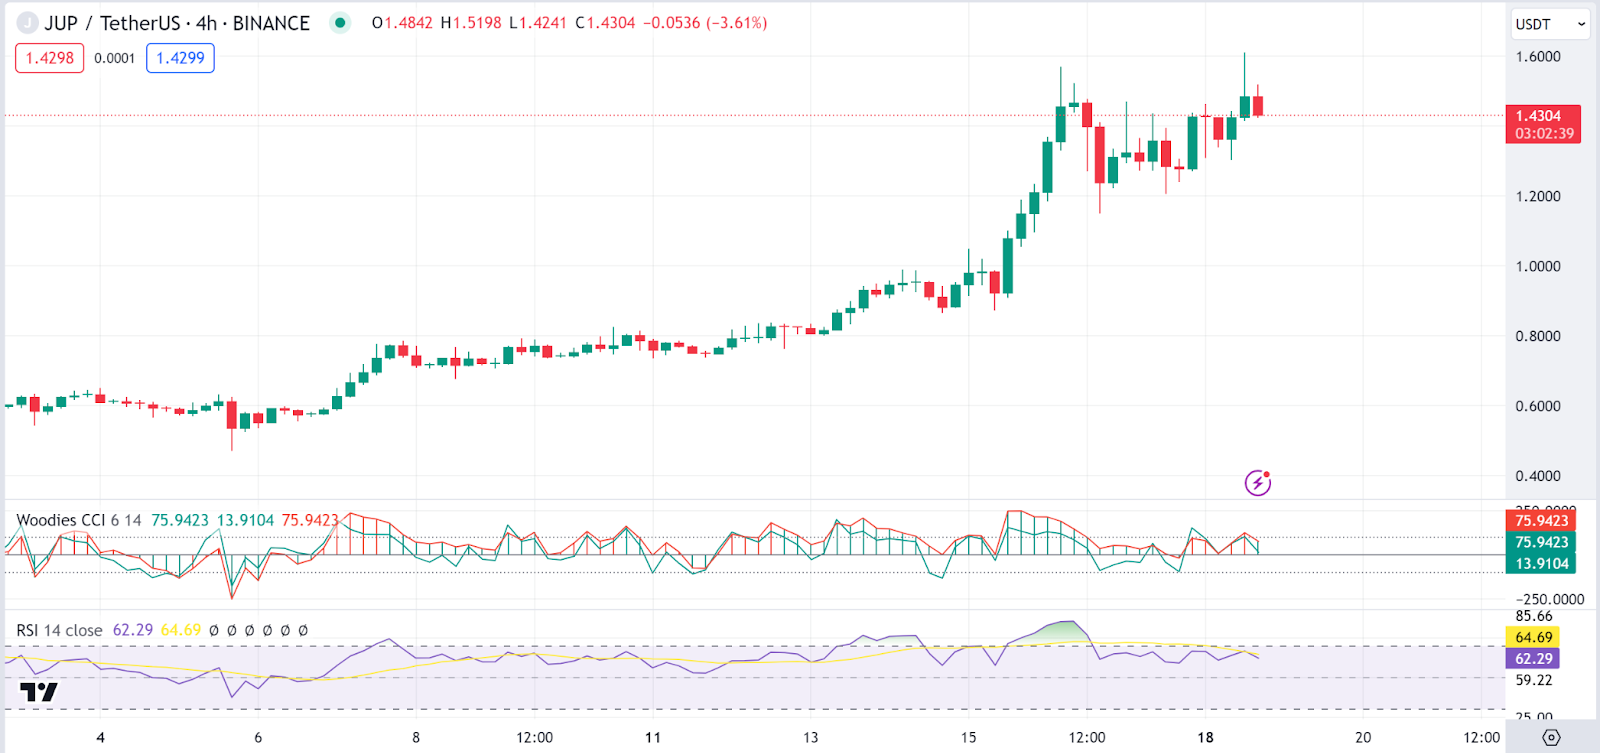
However, Jupiter (JUP) also defied the odds to emerge in the gainers list. The Jupiter price action has been volatile with sharp rises and falls, but the general movement is upward. The Woodies CCI shows significant swings above and below the zero line, indicating high volatility.
The Relative Strength Index (RSI) is above 50, suggesting bullish momentum, but it’s not in the overbought territory, which might indicate there is room for upward movement. The Jupiter price stood at $1.49 as of press time representing a jump of 16.3% over the last 24 hours.
Source: https://blockchainreporter.net/daily-market-review-eth-apt-avax-shib-jup/