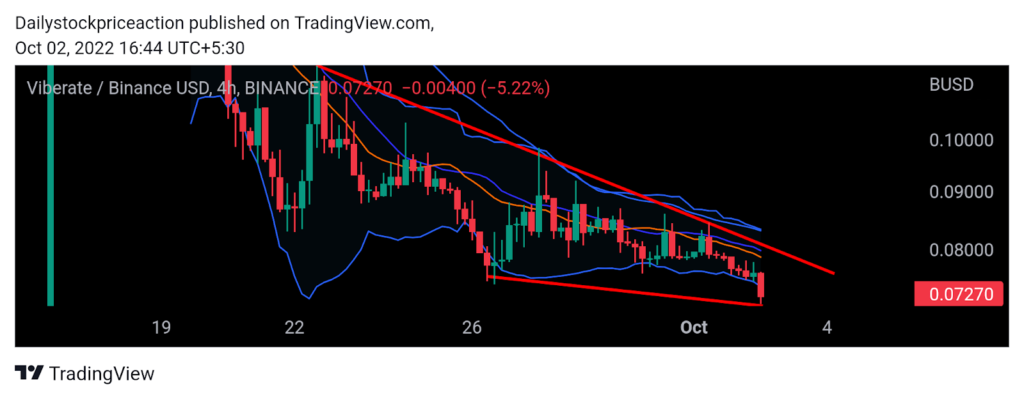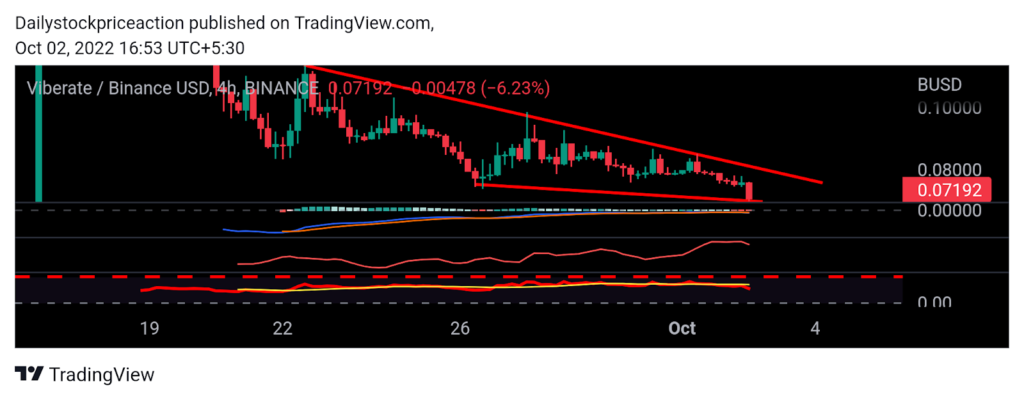
- The VIB token price is trading near the demand zone on a 4 hour time frame.
- The token price is forming a falling wedge pattern on a 4 hour time frame.
- The pair of VIB/ETH is trading at the price level of 0.00005966 with a decrease of 2.79% in the past 24 hours.

The VIB token price is trading at the demand zone on a daily time frame, as per the price action. The token price faced the strong bearish pressure that prevailed in the market during the past week which led to a fall in the price of the VIB token price. The VIB token price showed a one-sided bullish rally and started falling from the supply zone. The VIB token price is forming higher high and higher low formation on a daily time frame. The token price can be seen rising if it is successfully able to break out of the supply zone.
At present, the token price is trading below the 50 and 25 Moving Averages. The recent bullish rally has resulted in the token price breaking out of the 50 and 25 Moving Averages. Moving upwards the token price can be seen resting at these important MAs during the pullbacks. Currently, the token price is trading at the middle of the Bollinger band indicator after failing to surpass the upper band. The range of the Bollinger Band indicator has narrowed indicating a strong move on the breakout side. Volumes have increased as the token price bounced off the demand zone strongly. Investors should remain cautious as volatility has increased due to recent big moves.
The VIB token price is hovering around the demand zone forming a falling wedge pattern

Average Directional Movement Index: As the token price entered a period of consolidation, the ADX curve was in a downward trend. The ADX curve recently fell below the threshold of 30. The ADX curve is currently trading at 24.42. The ADX curve can also be observed sinking out of the 20-mark zone if the token price crosses the significant short-term supply zone, corroborating the pattern. The sideways movement of the ADX curve suggests a halt in price movement and a potential shift in the price structure in a shorter time frame.
Relative Strength Index:
The RSI curve is currently trading at a level of 46.79. The RSI curve has not yet surpassed the 50-percent mark at this time. The RSI curve will begin to move higher once the price of the VIB token crosses the supply zone. The 20 EMA has also been crossed by the RSI curve. The RSI curve is rising despite the consolidation phase, signaling that bullish momentum is about to burst
Moving Averages Convergence and Divergence: As the price of the token declined, the MACD signal turned negative. The token price broke the critical demand zone in a lower time period, as seen on the chart, and as a result the MACD indicator also produced a bearish crossover. On the downside, the blue line passed the orange line. The MACD lines may be observed widening the MACD lines if the token price falls any lower.
Conclusion
The VIB token price has managed to sustain above the demand zone forming a reversal chart pattern. Despite the bearish pressure or emailing in the market, the token price showed strength. As the technical parameters suggest, the token price is bearish for the short term. Investors should remain cautious and wait for a clear trend.
SUPPORT: $0.069 and $0.067
RESISTANCE: $0.074 and $0.078
Disclaimer
The views and opinions stated by the author, or any people named in this article, are for informational ideas only, and they do not establish the financial, investment, or other advice. Investing in or trading crypto assets comes with a risk of financial loss.
Source: https://www.thecoinrepublic.com/2022/10/02/vibrate-token-price-analysis-vib-token-price-is-in-a-pullback-as-the-token-price-continues-to-rise-higher/
