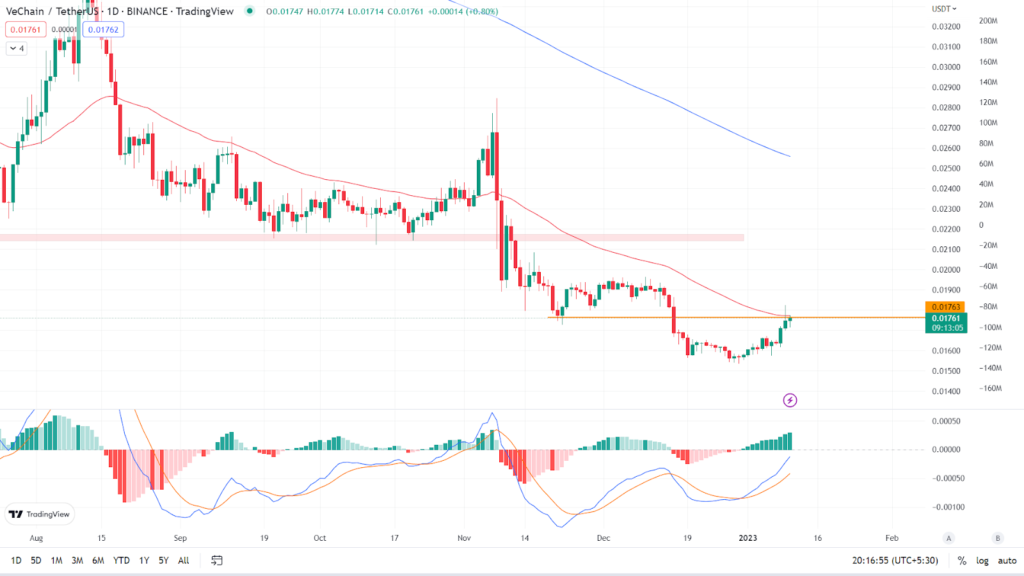
- The VET token price is trading below the demand zone on a daily time frame.
- Token has shown bullish actions in previous sessions.
VET has seen a severe price decline of more than 95% since its debut (5 years). For short to medium term holdings, that has so far made things worse. Many think that investing in cryptocurrencies long-term may not be the greatest idea.
VET on the daily time frame

The price has dropped below the demand zone after the token gave a downward breakout following consolidation above the demand zone. VET is presently trading at $0.01761, a gain of 1.37% in the last 24 hours, as seen on the chart. Price is now trading below the major Moving Averages of the 50 and 200 EMAs. (Red line is 50 EMA and the blue line is 200 EMA). Bears prevented the bulls from dominating and prevented them from crossing the 50 EMA, which resulted in a significant rejection for the token.
MACD: MACD indicator is indicating bullish trend. A bullish crossover has occurred on the MACD. A bullish crossover occurs when the MACD blue line crosses the Orange signal line in an upward direction. The occurrence of a bullish crossover on the MACD shows that the token has gained bullish momentum on the daily chart.
Analyst view & Expectations
After consolidating for a while the token gave a breakout in upward direction but faced strong resistance near 50 EMA. If the bulls are unable to cross and maintain above the 50 EMA in the coming days, the token’s downtrend will continue, with price forming lower highs and lower lows. Investors are advised not to buy now and to wait for more information on the trend’s direction. Intraday traders, on the other hand, have a good opportunity to go short if a big red candle forms near the 50 EMA.
According to our current VeChain (VET) price prediction, the value of VeChain (VET) is expected to fall by -3.31% over the next several days, reaching $ 0.017235. Our technical indicators indicate that the current sentiment is Neutral, with the Fear & Greed Index reading 26. (Fear). Over the previous 30 days, VeChain had 12/30 (40%) green days and 6.52% price volatility. According to our VeChain forecast, not is a good time to buy VeChain.
Technical Levels
Major support: $0.155
Major resistance: $0.1943
Conclusion
On a daily time frame, the VET token’s price has fallen below the demand zone. Based on price action, the VET token is forming a bearish chart pattern. It remains to be seen if the token price will bounce off the long-term demand zone or break through and decline. Before taking action, investors should wait for a clear indication.
Disclaimer: The views and opinions stated by the author, or any people named in this article, are for informational ideas only, and they do not establish the financial, investment, or other advice. Investing in or trading crypto assets comes with a risk of financial loss.
Source: https://www.thecoinrepublic.com/2023/01/13/vet-price-analysis-token-shows-bullish-momentum-trend-reversal-or-pullback/
