The market cap of the Render crypto has declined by 0.19% in the last 24 hours, resulting in $736.777M. The volume/market cap of the crypto followed in the last 24 hours as per the Coinmarketcap is 5.32%.
The trading volume of the RNDR crypto has also declined by 1.87%, which represents the lack of interest of traders in the coin. The circulating supply of the crypto is 371.908M RNDR.
The fully diluted market cap of the RNDR token is $1.065B and the all-time high price hit by the crypto is $8.78. This token’s price has declined by more than 75% since it hit the all-time-high level.
The volume/market cap ratio of the crypto is 0.0511 and the market cap dominance of the RNDR crypto based upon its market cap is 0.061%.
Higher High Structure Formation In RNDR Crypto Charts, What’s Next?

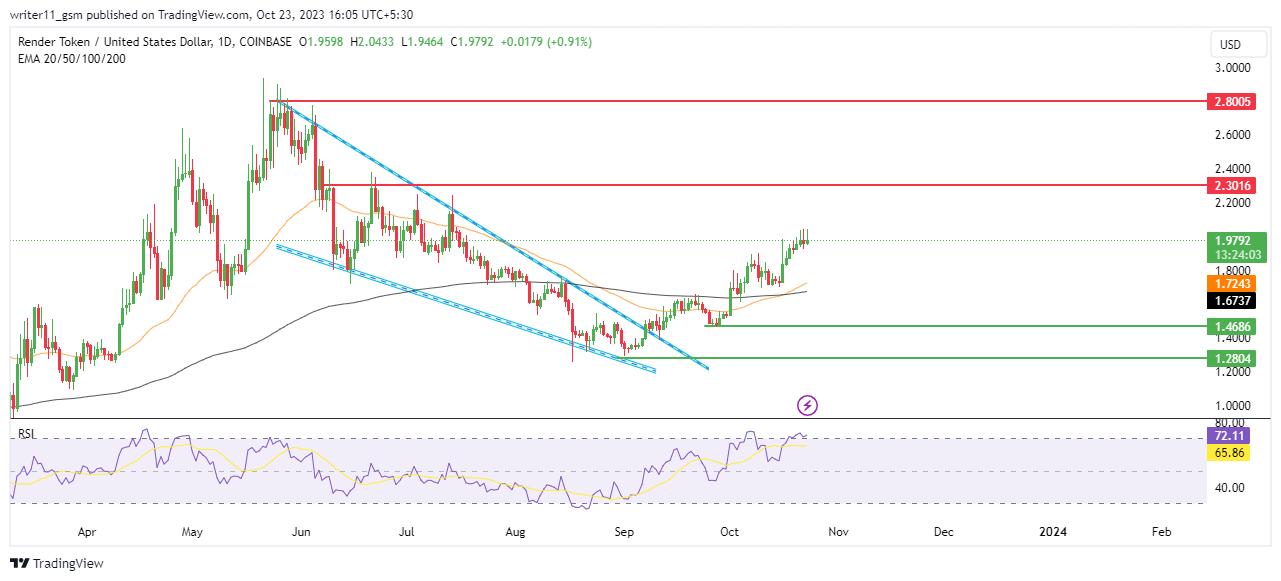
After advancing the price by more than 600% from January 2023 to May 2023, the RNDR token price started to decline. It resulted in the formation of a lower low pattern, leading to a falling wedge pattern. The crypto price broke out above the pattern and the price has advanced by more than 4% in just the last seven days.
The 50-day and the 200-day EMAs on the daily chart have given a fresh breakout, resulting in the golden cross. It is led by the advancing price momentum in the stock.
The RSI is also acting bullish as it has advanced to the overbought zones and also above the 14-day SMA. It makes the RSI bullish on the charts, showing the advancing price cycle in the crypto.
RNDR Liquidation Analysis

The RNDR coin has not witnessed any significant change in the last 24 hours. It witnessed a decline of 15.19% in the trading volume. The open interest has also shown a decline of 3.21%, resulting in $38.87M. The witnessed long liquidation is also higher than the short liquidation. It shows that the sellers are more powerful in the market.
Conclusion
The crypto price data suggests a weakness in the RNDR coin price. It can also be a sign of losing momentum in the crypto. Based on the technical charts, the token price is bullish. Despite that, the RNDR crypto is forming wicks on the higher side of the candle. It again represents weakness.
Thus, uncertainty is being created in the charts of the RNDR crypto, which makes it unreliable for the moment.
Technical Levels
- Support levels- $1.2800 and $1.4600
- Resistance levels- $2.300 and $2.800
Disclaimer
The views and opinions stated by the author or any other person named in this article, are for informational purposes only and do not constitute financial, investment, or other advice. Investing in or trading crypto or stocks comes with a risk of financial loss.
Source: https://www.thecoinrepublic.com/2023/10/23/will-rndr-crypto-sustain-the-advancing-price-momentum-in-future/