This analysis report, backed by quality data, covers the major developments the Web3, Blockchain and Crypto sector has experienced this week.
1. Breaking News This Week
- Ethereum’s Eclipse CEO Steps Back Amid Misconduct Allegations
Neel Somani, CEO of Ethereum’s Eclipse project, reduces role following sexual misconduct allegation, asserting innocence while acknowledging gravity of situation.
- Kraken Questions SEC’s Case Amid Ongoing Dispute
Kraken challenges SEC’s lawsuit accuracy, three months after filing motion to dismiss, regarding charges of unregistered brokerage activities.
- Bitcoin Falls as Federal Reserve Mulls Inflation Combat Tactics
Bitcoin price drops to $60,934.11 as Federal Reserve evaluates strategies against persistent inflation in the United States.
- Nigerian Government Denies Binance Bribery Allegations
Nigerian government refutes Binance CEO’s claim of $150 million bribe demand to settle criminal charges, labelling allegations as baseless diversionary tactics.
- Canada Fines Binance Over Anti-Money Laundering Violations
Canada imposes fine on Binance for violating anti-money laundering regulations, citing non-compliance with rules related to operating as foreign money services business.
- Trump Plans Cryptocurrency Donations for Election Campaign
Former President Trump intends to accept cryptocurrency donations for his 2024 U.S. presidential campaign, signalling a shift in approach toward crypto compared to the Biden administration.
- White House Blocks Republican Effort on Crypto Custody Services
White House vows to veto House Resolution 109 aimed at freeing banks to offer crypto custody services, despite passing through the House of Representatives, halting hopes for U.S. crypto banking.
- Chainlink Integration Powers Hong Kong Dollar Stablecoin
RD Technologies integrates Chainlink CCIP and Proof of Reserve to support Hong Kong dollar stablecoin, enabling secure cross-chain transfers and on-chain verification of reserve backing.
- SEC Issues Wells Notice to Robinhood Amid Legal Threat
Robinhood receives Wells Notice from SEC, adding to list of crypto trading platforms facing legal action, asserts platform doesn’t list securities, deeming SEC’s case weak.
2. Blockchain Performance
In this section, we will analyse two factors primarily: the top-performing blockchains based solely on their 7-day change and the top performers among the top five blockchains with the highest TVL.
2.1. Top Blockchain Performers by 7-Day Change
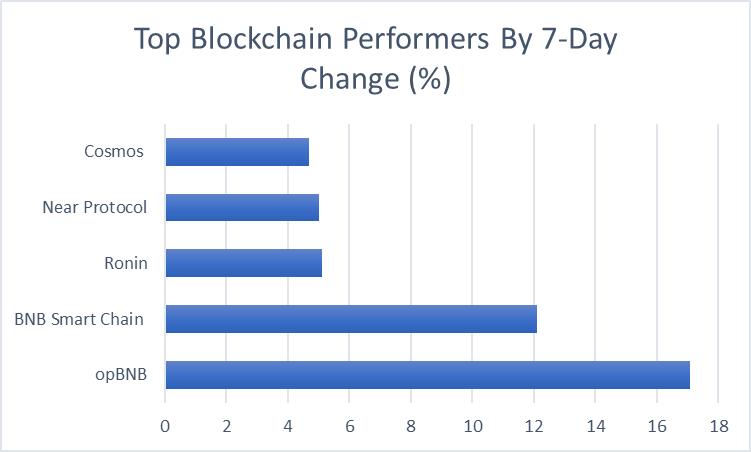
This week’s top blockchain performers, based on their 7-day change, are opBNB, BNB Smart Chain, Ronin, Near Protocol, and Cosmos. Last week, the top performers were Core, ZetaChain, StarkNet, Scroll and Filecoin. None of these chains could enter the list this week.
| Blockchain | 7-Day Change (in %) | TVL |
| opBNB | +17.1% | $29,035,685 |
| BNB Smart Chain | +12.1% | $6,029,605,772 |
| Ronin | +5.1% | $187,485,507 |
| Near Protocol | +5.0% | $317,732,963 |
| Cosmos | +4.7% | $1,372,069 |
opBNB marks the highest 7-day change of +17.1%. BNB Smart Chain closely follows with +12.15%. Ronin, Near Protocol, and Cosmos register +5.1%, +5.0% and +4.1% respectively.
2.2. Top Performers: 7-Day Change in Top 5 Blockchains with Highest TVL
Ethereum, TRON, BNB Smart Chain, Solana, and Arbitrum One are the top five blockchains in the market on the basis of TVL and market dominance. Let’s see how the top five blockchains have performed this week, using 7-day TVL change.
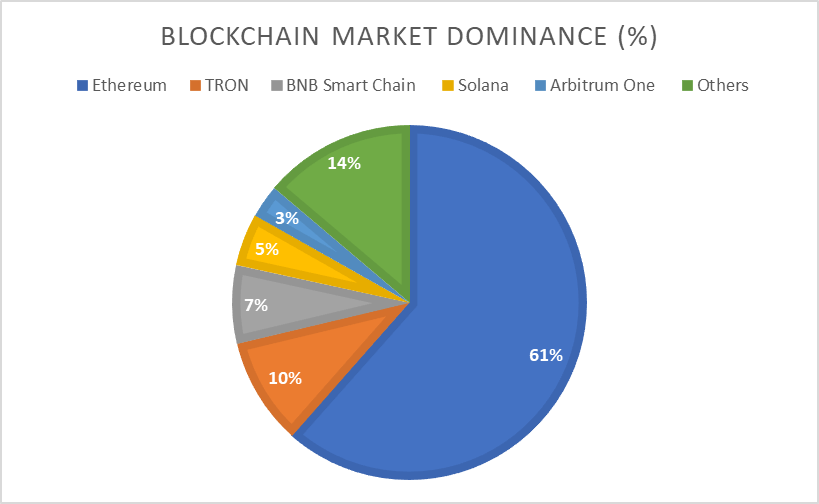
Compared to the last week, this week, the dominance of Ethereum has slightly decreased from 63.26% to 61.52%. Similarly, BNB Smart Chain has seen an increase from 6.18% to 7.15%.
| Blockchain | Dominance (in %) | 7d Change (in %) | TVL |
| Ethereum | 61.52% | -5.7% | $51,847,288,647 |
| TRON | 9.74% | -2.3% | $8,211,022,800 |
| BNB Smart Chain | 7.15% | +12.1% | $6,029,605,772 |
| Solana | 4.77% | +2.6% | $4,022,451,729 |
| Arbitrum One | 3.01% | -3.4% | $2,540,928,822 |
| Others | 13.80% |
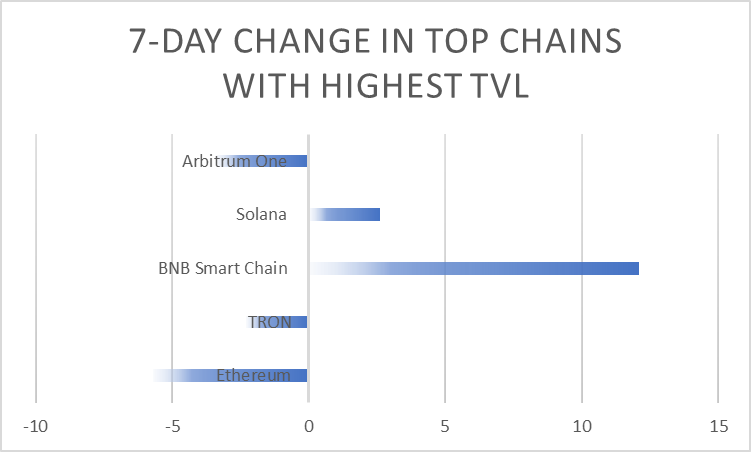
Among the top five chains by TVL, BNB Smart Chain marks the highest 7-day change of +12.1%. Solana follows with +2.6%. The chain with the highest negative 7-day change is Ethereum, which records a change of -5.7%. Arbitrum One follows with a negative change of -3.4%
Also Read: Blockchain Report & Market Insights for April 2024: What You Should Know
3. Crypto Market Analysis
The crypto 7-day price change and dominance analysis and top gains and losers analysis are the two prime areas of the crypto market analysis.
3.1. Crypto 7-D Price Change and Dominance Analysis
Bitcoin, Ethereum, Tether, BNB, and Solana are the top cryptocurrencies as per the market cap and dominance indices. Let’s analyse their seven-day price change.
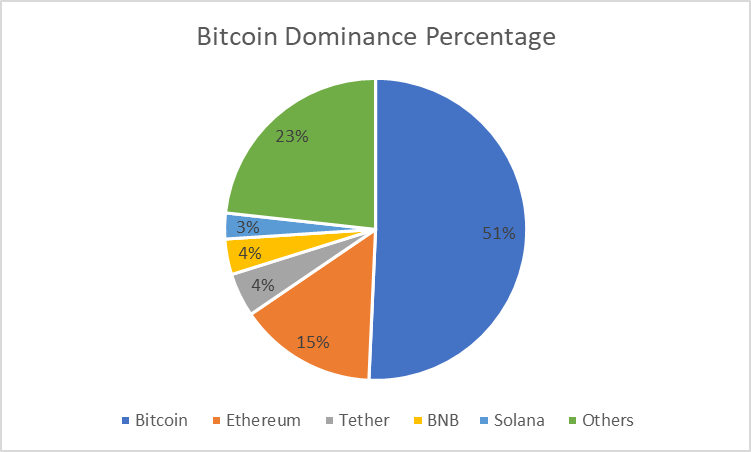
Compared to the previous week, the dominance of Ethereum has slightly reduced from 15.23% to 14.78%. Others have experienced only minimal changes.
| Cryptocurrency | 7-D Change (in %) | Dominance Percentage | Price | Market Cap |
| Bitcoin | -3.9% | 50.71% | $60,934.11 | $1,200,268,706,365 |
| Ethereum | -6.4% | 14.78% | $2,921.19 | $350,807,094,812 |
| Tether | -0.0% | 4.68% | $1.00 | $110,844,032,187 |
| BNB | +0.0% | 3.81% | $586.70 | $90,180,359,491 |
| Solana | +0.4% | 2.77% | $145.83 | $65,235,323,274 |
| Others | 23.25% |
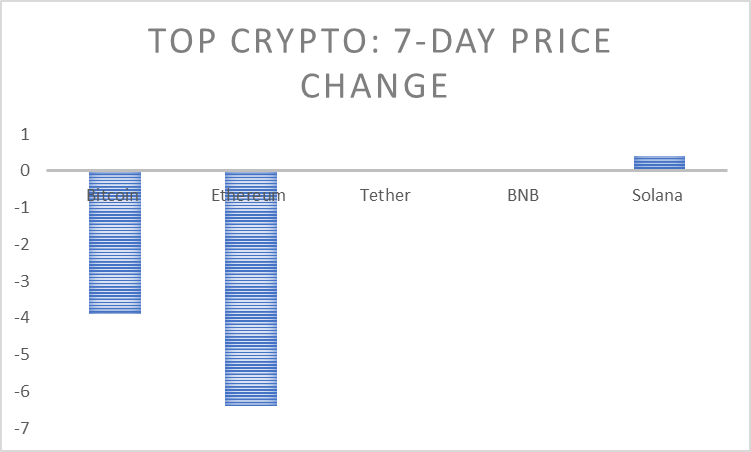
Among the top five cryptocurrencies by market cap, only Solana marks a positive change; it records a change of +0.4%. The highest negative change is shown by Etherem, which registers a change of -6.4%.
Last week, Bitcoin and Tether showcased positive changes. This time, Bitcoin displays a negative change of -3.9%, and Tether shows a change of -0.0%
3.2. Top Gainers & Losers of the Week in Crypto Market
Here is the list of top gainers and top losers of the week in the cryptocurrency market. The analysis is made using the 7-day Gain and 7-day Lose indices.
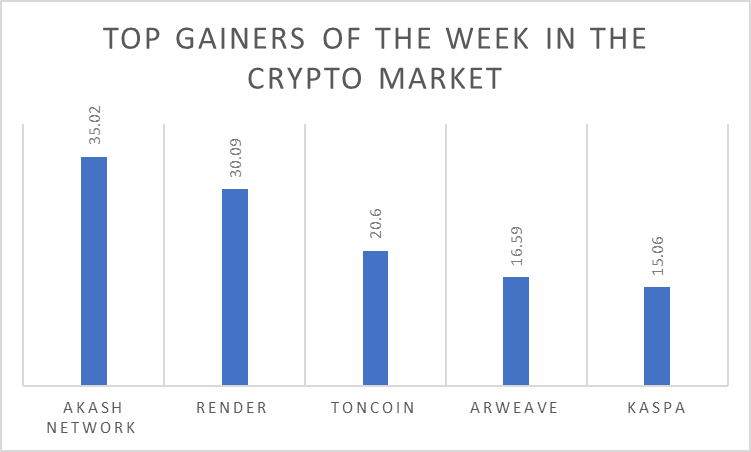
3.2.1. Top Gainers of the Week in Crypto
| Cryptocurrency | 7-Day Gain | Price |
| Akash Network | +35.02% | $5.85 |
| Render | +30.09% | $10.87 |
| Toncoin | +20.60% | $6.97 |
| Arweave | +16.59% | $41.24 |
| Kaspa | +15.06% | $0.1283 |
Akash Network, with +35.02% gain, is the top gainer of the week. Render and Toncoin follow with +30.09 gain and +20.60% gain, respectively. Arweave and Kaspa show +16.59% gain and +15.06% gain, respectively.
In the previous week, Pepe was the top gainer. That time, a trend favourable towards memecoins was visible. This time, what we see is a trend favouring AI & Big Data tokens.
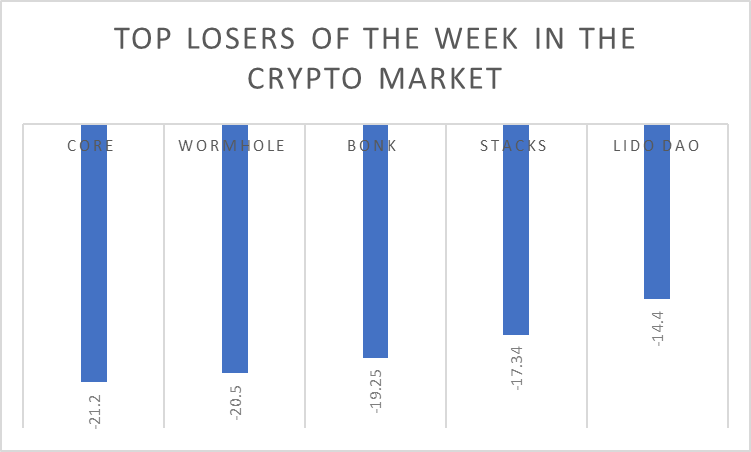
3.2.2. Top Losers of the Week in Crypto
| Cryptocurrency | 7-Day Loss | Price |
| Core | -21.20% | $1.62 |
| Wormhole | -20.50% | $0.5974 |
| Bonk | -19.25% | $0.00002309 |
| Stacks | -17.34% | $2.01 |
| Lido DAO | -14.40% | $1.78 |
Core, with a 7-day loss of -21.20%, is the top loser of the week. Wormhole follows with a 7-day loss of -20.50%. Bank registers a loss of -19.25%, and Stacks displays a loss of -17.34%. Lido DAO reports a loss of -14.40%.
Last week, the biggest losers were Helium, Sui, Ondo, Polkadot, and Beam. This time, we see none of them in the list, giving an impression that they have improved its performance.
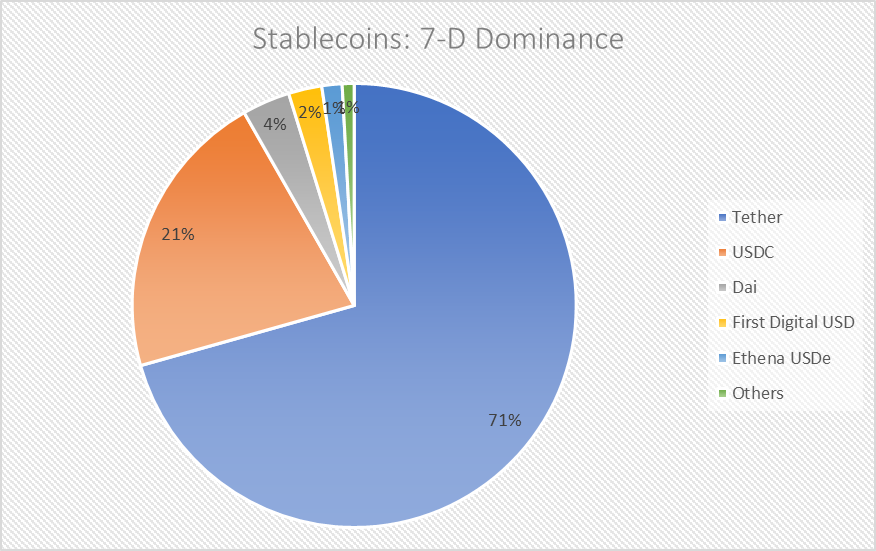
3.3. Stablecoin Weekly Analysis
Tether, USDC, DAI, First Digital USD, and Ethena USDe are the top stablecoins in the market in terms of market capitalization. Let’s analyse their weekly performance using seven-day market capitalisation, market dominance and trading volume indices.
| Stablecoins | Market Dominance (7d) [in %] | Market Capitalisation (7d) | Trading Volume (7d) | Market Capitalisation |
| Tether | 70.63% | $110,774,390,760 | $43,232,517,723 | $110,839,699,373 |
| USDC | 21.11% | $33,104,074,658 | $6,085,824,820 | $33,106,032,488 |
| Dai | 3.48% | $5,459,263,317 | $591,430,715 | $5,465,103,817 |
| First Digital USD | 2.43% | $3,813,866,678 | $6,017,294,988 | $3,818,135,796 |
| Ethena USDe | 1.47% | $2,302,513,937 | $55,284,303 | $2,302,847,630 |
| Others | 0.87% |
Tether dominates the stablecoin market with a dominance percentage of 70.63%. USDC follows with an impressive dominance percentage of 21.11%. Dai, First Digital USD and Ethena USDe show 3.48%, 2.43% and 1.47% dominance, respectively.
Compared to the previous week’s market dominance data, we see no significant changes in dominance of any of the top five stablecoins.
3.3.1. Stablecoin Weekly Price Analysis
Let’s analyse the weekly performance of the top stablecoins further using the seven-day price change index.
| Stablecoins | 7-Day Price Change (in %) | Price |
| Tether | -0.0% | $1.00 |
| USDC | -0.2% | $1.00 |
| Dai | +0.1% | $0.9982 |
| First Digital USD | -0.0% | $1.00 |
| Ethena USDe | +0.3% | $1.00 |
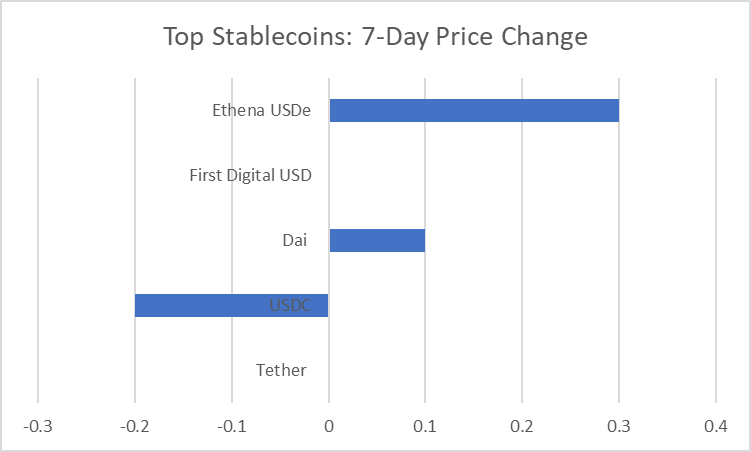
Among the top five stablecoins by dominance, this week, Ethena USDe and Dai display +0.3% and +0.1% change, respectively. USDC shows a negative change of -0.2%. Tether and First Digital USD showcase no change.
Last week, only Dai showed stability. The others showed positive changes, ranging from +0.1% to +0.4%
Also Check Out: Stablecoin April 2024 Report: An In-Depth Performance Analysis.
4. Bitcoin ETF Weekly Analysis
Bitcoin Futures ETFs and Bitcoin Spot ETFs should be analysed separately, in order to get the right picture of the Bitcoin ETF market, as they represent two different segments. Let’s start!
4.1. Bitcoin Futures ETF Weekly Analysis
ProShares (BITO), VanEck (XBTF), Valkyrie (BTF), Global X (BITS), and Ark/21 Shares (ARKA) are the top Bitcoin Future ETFs, as per the Asset Under Management index. Let’s use the price change percentage index to analyse these ETFs.
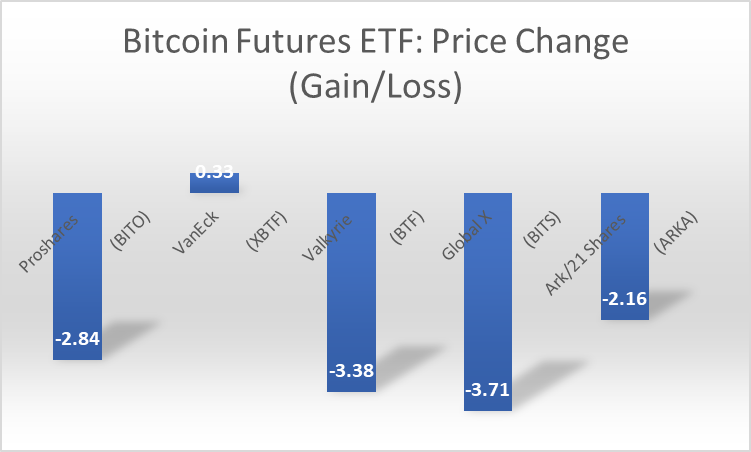
| Bitcoin Futures ETFs | Price Change (Gain/Loss) [in %] | Asset Under Management (in Million) | Price |
| Proshares (BITO) | -2.84% | $598.78M | $24.64 |
| VanEck(XBTF) | +0.33% | $42.41M | $39.22 |
| Valkyrie (BTF) | -3.38% | $38.20M | $17.44 |
| Global X(BITS) | -3.71% | $26.10M | $59.63 |
| Ark/21 Shares (ARKA) | -2.16% | $8.01M | $58.36 |
Among the top five Bitcoin Futures ETFs by Asset Under Management, this week, only VanEck shows a positive change of +0.33%. The others showcase negative changes. With -3.71% change, Global X records the highest negative change. Valkyrie, Proshares and Ark/21 Shares follow with -3.38%, -2.84% and -2.46%.
In the previous week, all of these ETFs expressed positive changes. The one with the highest change was Ark/21 Shares, which recorded a change of +4.72%.
4.2. Bitcoin Spot ETF Weekly Analysis
Grayscale (GBTC), Blackrock (IBIT), Fidelity (FBTC), Ark/21 Shares (ARKB), and Bitwise (BITB) are the top Bitcoin Spot ETFs, as per the Asset Under Management index. Let’s analyse them using the price change index.
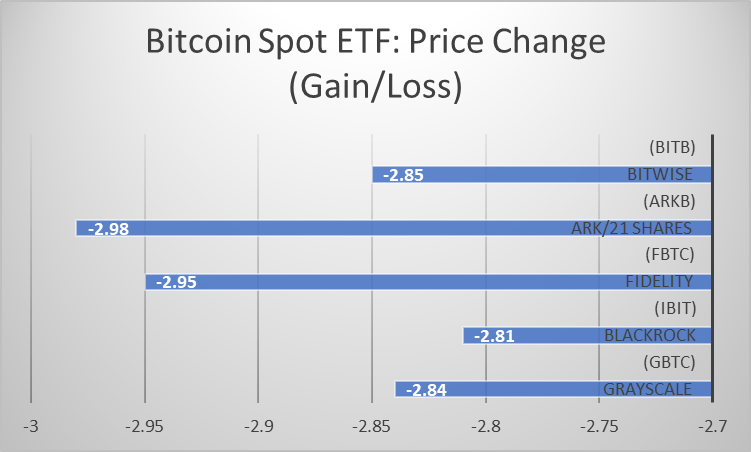
| Bitcoin Spot ETFs | Price Change (Gain/Loss) [in %] | Asset Under Management (in Billion) | Price |
| Grayscale (GBTC) | -2.84% | $24.33B | $53.99 |
| BlackRock(IBIT) | -2.81% | $17.24B | $34.58 |
| Fidelity (FBTC) | -2.95% | $9.90B | $53.05 |
| Ark/21 Shares (ARKB) | -2.98% | $2.85B | $60.64 |
| Bitwise (BITB) | -2.85% | $2.16B | $33.07 |
Among the top five Bitcoin Spot ETFs by AUM, none of them show a positive change. Ark/21 Shares records the highest negative change of -2.98%. The others closely follow with changes ranging between -2.95% to -2.81%.
Last week, all of these ETFs displayed positive changes. None of them showed a change lower than 4%.
This Might Interest You: Should You Invest in Bitcoin ETFs? Detailed Monthly Review and Analysis for April 2024
5. DeFi Market Weekly Status Analysis
Lido, EigenLayer, AAVE, Maker, and JustLend are the five top DeFi protocols on the basis of TVL. Let’s analyse its weekly performance using the 7d Change index.
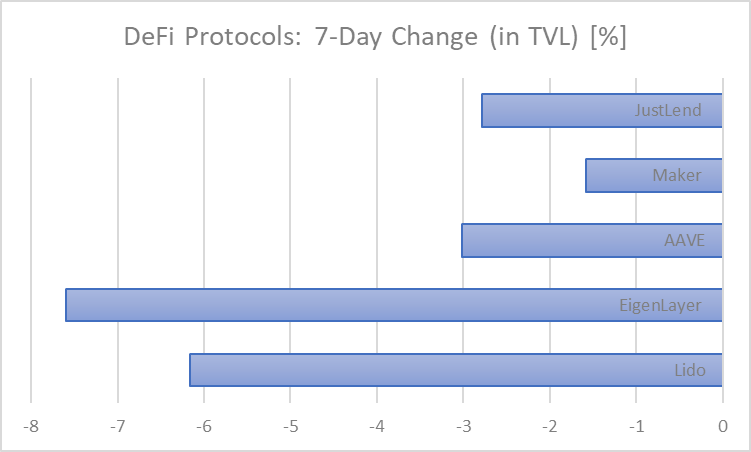
| DeFi Protocols | 7d Change (in Total Value Locked) [in %] | TVL |
| Lido | -6.16% | $27.448B |
| EigenLayer | -7.60% | $14.368B |
| AAVE | -3.02% | $10.297B |
| Maker | -1.58% | $8.062B |
| JustLend | -2.78% | $5.963B |
Among the top five DeFi protocols by TVL, this week, none of them registers positive changes. The highest negative change of -7.60% is recorded by EigenLayer. Lido closely follows with -6.16%. AAVE, Just Lend and Maker display -3.02%, -2.78%, and -1.58%, respectively.
Last week, all of these DeFi protocols experienced positive changes. EigenLayer recorded the highest positive change of +1.08%. Maker followed with a change of +0.95%.
6. NFT Marketplace: A Basic Weekly Analysis
Blur, Blur Aggregator, Cryptopunks, Gem and X2Y2 are the top NFT marketplaces on the basis of market share. Let’s analyse them using the Volume Change (change of last 7d volume over the previous 7d volume) index.
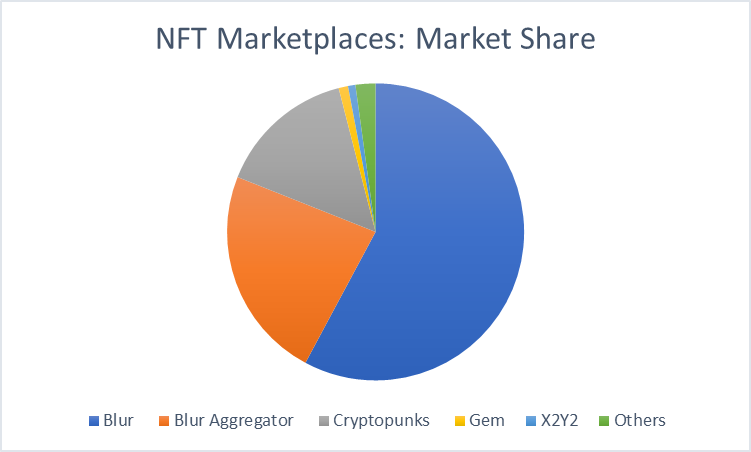
Compared to the previous week, this week the market share of Cryptopunks has witnessed a considerable increase from 2.99% to 14.98%. Conversely, Blur has experienced a notable reduction from 69.55% to 57.83%.
| NFT Marketplaces | Volume Change [Last 7 Day over the Previous 7 Day Volume] | Market Share | 7-day Rolling Volume | 7-day Rolling Trades |
| Blur | -29.12% | 57.83% | 11414.71 | 21540 |
| Blur Aggregator | -30.39% | 23.19% | 5075.31 | 9015 |
| Cryptopunks | +15.57% | 14.98% | 1520.48 | 31 |
| Gem | -1.02% | 1.02% | 269.54 | 1457 |
| X2Y2 | +32.90% | 0.81% | 300.36 | 158 |
| Others | 2.17% |
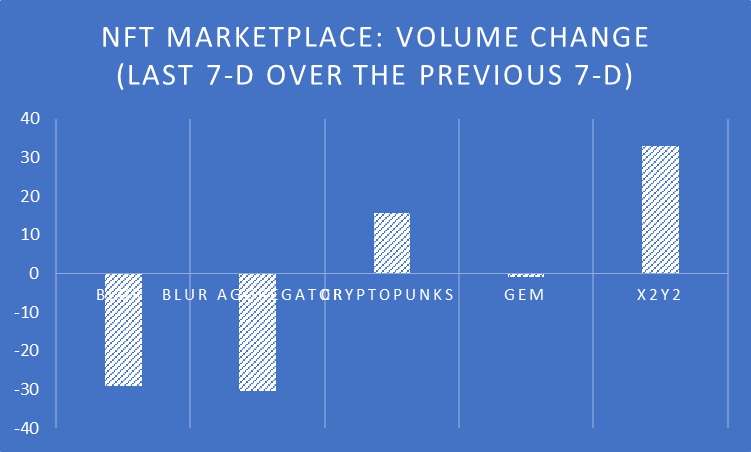
Among the top five NFT marketplaces by market share, this week, X2Y2 records the highest volume change of +32.90%. Cryptopunks follows with +15.57%. Gem registers a change of -1.02%. Blur Aggregator and Blur show -30.39% and -29.12% change, respectively.
In the previous week, the only one market place which showcased a positive change was Blur. It marked a change of +17.82%. That week, Cryptopunks, with -73.99% change, was the one that showed the highest negative change.
6.1. Top NFT Collectible Sales this Week
CryptoPunks #3619, CryptoPunks #4926, Azuki #4357, CryptoPunks #2549, and BOOGLE #Hwh6Z4 are the top NFT collectable sales reported this week in the NFT market landscape.
| NFT Collectibles | Price (in USD) |
| CryptoPunks #3619 | $627,990.88 |
| CryptoPunks #4926 | $329,252.84 |
| Azuki #4357 | $273,445.56 |
| CryptoPunks #2549 | $194,213.80 |
| BOOGLE #Hwh6Z4 | $192,124.10 |
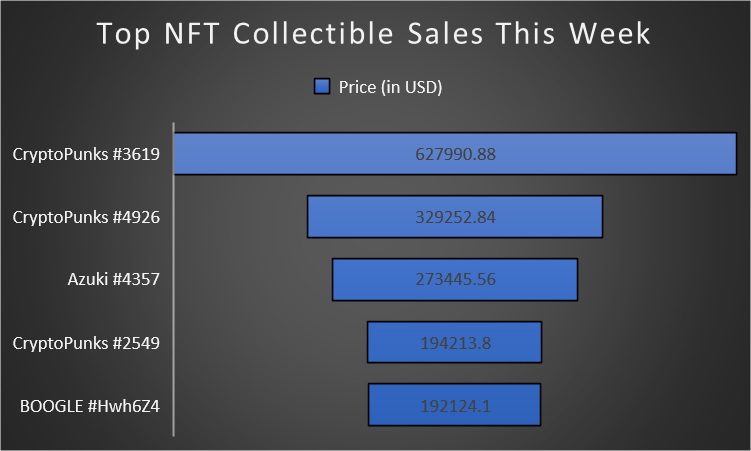
CryptoPunks #3619 is priced at $627,990.88, which is the highest recorded this week. CryptoPunks #4926, priced at $329,252.84, is the second best price. Azuki #4357 ($273,445.56) and CryptoPunks #2549 ($194,213.80) hold the third and fourth positions in terms of price, respectively. BOOGLE #Hwh6Z4 is priced at $192,124.10.
7. Web3 Weekly Funding Analysis
7.1. General Crypto Fundraising Trend Analysis
Between May 6th and 12th, 2024, the number of fundraising rounds reported is over 30. The total funds raised in this period is around $142.50M. Previous week, between April 29th and May 5th, 2024, the number of fundraising rounds reported was 30, the same as the one reported now. But, the total funds raised in that period was $143.96M, slightly higher than the one reported this week.
The two prime areas of the general crypto fundraising trend analysis are the crypto fundraising by category analysis and the top crypto investment locations analysis.
7.1.1. Crypto Fundraising by Category This Week
Blockchain Infrastructure, Blockchain Services, CeFi, Chain, DeFi, GameFi, NFT and Social are the categories, which witnessed activities this week. Let’s analyse them using the Number of Fundraising Rounds and Funds Raised in USD indices.
| Category | Number of Fundraising Rounds May 6 – 12, 2024 | Funds Raised in USDMay 6 – 12, 2024 |
| Blockchain Infrastructure | 7 | $41.90M |
| Blockchain Services | 8 | $25.10M |
| CeFi | 4 | $32.50M |
| Chain | 3 | $9.50M |
| DeFi | 2 | $7.00M |
| GameFi | 3 | $13.50M |
| NFT | 2 | $10.00M |
| Social | 1 | $3.00M |
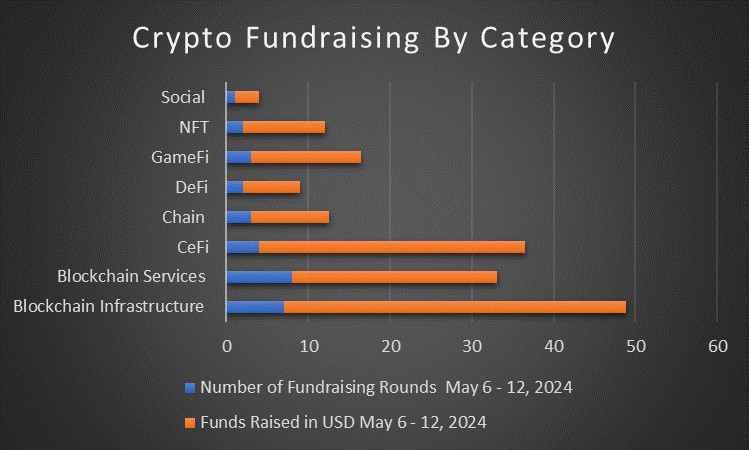
This week, Blockchain Infrastructure, raised the highest amount of $41.90M, receives the first position. CeFi, raised $32.50M, gets the second. Blockchain Services, with $25.10M, remains in the third position. GameFi, NFT and Chain raised $13.50M, $10.00M, and $9.50M, respectively. DeFi and Social secured $7.00M and $3.00M, respectively.
In the previous week, CeFi, raised $47.00M, was the category that attained the first position in terms of funds raised. DeFi and Social followed with $28.00M and $20.00M funds raised, respectively.
7.1.2. Top Crypto Investment Locations This Week
Apart from the undisclosed, Singapore, Switzerland, United States, Sweden, Hong Kong and United Kingdom are the top crypto investment locations this week.
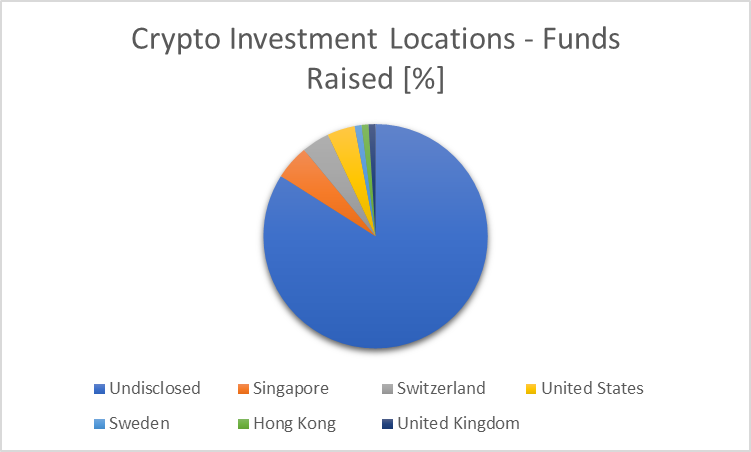
| Crypto Investment Locations | Funds Raised in (%) | Funds Raised in USD | Number of Fundraising Rounds |
| Undisclosed | 84% | $120.76M | 23 |
| Singapore | 5% | $7.00M | 1 |
| Switzerland | 4% | $5.50M | 1 |
| United States | 4% | $5.60M | 2 |
| Sweden | 1% | $1.60M | 1 |
| Hong Kong | 1% | $1.50M | 1 |
| United Kingdom | 1% | $1.00M | 1 |
This week, Undisclosed raised the highest amount of $120.76M, which is almost 84% of the total funds raised. Singapore and Switzerland secured $7.00M and $5.50M, respectively, which are just 5% and 4% of the total funds raised. The United States raised $5.60M, which is also 4% of the total amount raised. Sweden, Hong Kong, and the United Kingdom attained $1.60M, $1.50M, and $1.00M, respectively – each represents just 1% of the total funds raised.
Last week, the United States, which became the top performer by funds raised, amassed nearly $58.80M – which was around 45% of the total funds raised. This week, we see an unusual growth of Undisclosed – the amount of money it collected last week was under 43% of the total funds raised. What we see in undisclosed is a 41% gain in the share of the total funds raised; in the United States is a 41% loss.
7.2. ICO Landscape: A Weekly Overview
| ICO | Fund Received | Token Price | Fundraising Goal | Total Tokens | Token (Available for Sale) |
| Trailblaze | $1,430,000 | $0.015 | $730,000 | 420,000,000 | 30.3% |
| Morpheus | N/A | N/A | N/A | 42,000,000 | N/A |
Trailblaze and Morpheus are the major ICOs that ended this week. Let’s analyse how much amount they received. Trailblaze raised an impressive sum of $1,430,000. Its token price is $0.015 and its token (available for sale) is 30.3%.
8. Weekly Blockchain Hack Analysis
As of May 11th, 2024, hackers have stolen a total of $7.82 billion, mostly from decentralised finance (DeFi) platforms and blockchain bridges. DeFi platforms suffered the most significant losses, about $5.9 billion, while bridges connecting different blockchains lost around $2.83 billion.
The two major hacks reported recently are Yield Protocol Hack and Pike Finance Hack. Both these hacks were reported on the last day of the previous month, 30th April, 2024. Yield Protocol lost about $181,000 due to a balance disparity exploit. Around $1.6 million was stolen from Pink Finance using a storage misalignment exploit.
In the month of May, so far, no major hacks have been reported.
Endnote
In this week’s comprehensive analysis of Web3, Blockchain and Crypto, we have brought out powerful insights, which can be used to stay-to-data about the market developments. As the landscape evolves, the strategic integration of technology and data-driven decision-making becomes paramount for stakeholders navigating the dynamic realms of decentralised technologies.
Source: https://coinpedia.org/research-report/crypto-weekly-report-analyzing-the-weeks-key-events-and-market-movements-in-blockchain/