Tezos price analysis shows that the coin has been on a downtrend over the last 24 hours, with XTZUSD currently trading at $0.9688. The resistance for XTZUSD can be found at $0.9926, while support is at $0.966. If the bears continue to dominate and drive down price action, we could see Tezos drop below $0.966 in the near future. However, if the bulls manage to regain control, we could see the coin making a comeback and recovering some of its losses.
The bears took the price below $1.00 which was strong support and the key level for Tezos. This has given rise to fears that the coin could drop further in value as it trends toward $0.966. The Altcoin has decreased by over 1.6% over the past 24 hours and is currently down by 14% over the past week.
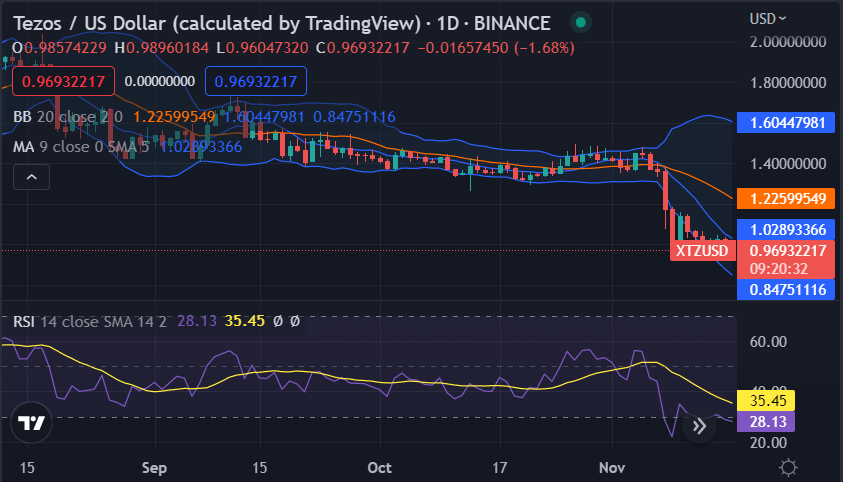
Tezos price analysis 1-day price chart: XTZ price levels decrease after today’s price action
The 1-day Tezos price analysis indicates a bearish trend for the day as the price has decreased down to the $0.9688 level today. The bearish activity has been intensifying for the second consecutive day; however, the downward oscillation of the price has slowed down a bit, but bulls also were battling to bring the price back to $1.00, which is now becoming a resistance.

The volatility is high for XTZ/USD pair, as the upper limit of the Bollinger bands is at the $1.60 mark, while the lower band is present at the $0.8475 mark. The Relative Strength Index (RSI) is trading at index 35.45 on an almost horizontal curve, hinting at the mixed market sentiment for XTZ. The moving average (MA) value in the 1-day price chart is also trading at $1.02 above the price level.
Tezos price analysis: Recent updates
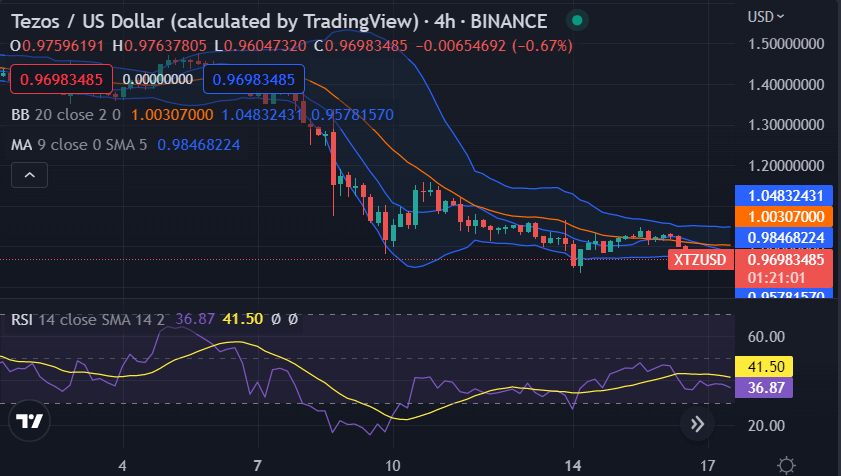
The 4-hour Tezos price analysis confirms that a downtrend has been taking place for the past few hours, as the price trend line is also slightly downwards. There have been instances where the bulls have encountered bearish resistance, but nonetheless, the downward trend has been maintained.

The price has been trading below the moving average (MA) value as well, which is present at $0.9846. The Bollinger bands are widening and hinting at a possible price drop in the near future. The RSI value is at 41.50, which suggests that the bears have currently gained control of price action.
Tezos price analysis conclusion
Tezos price analysis shows the downtrend has been going strong for the last 24 hours as bullish and bears are battling to gain control of XTZUSD and move the price in their favor. There are a few technical indicators hinting at a possible drop in price, while some suggest that the coin could recover its losses if bulls manage to take over. It remains to be seen what happens next with Tezos and whether it can continue on this downward trend or recover some of its recent losses.
Disclaimer. The information provided is not trading advice. Cryptopolitan.com holds no liability for any investments made based on the information provided on this page. We strongly recommend independent research and/or consultation with a qualified professional before making any investment decisions.
Source: https://www.cryptopolitan.com/tezos-price-analysis-2022-11-17/
