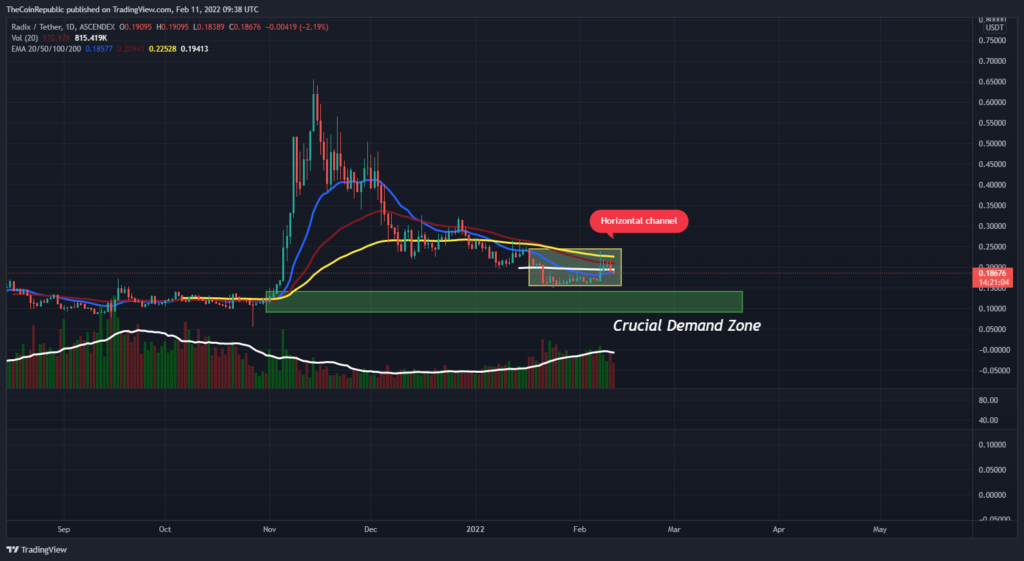
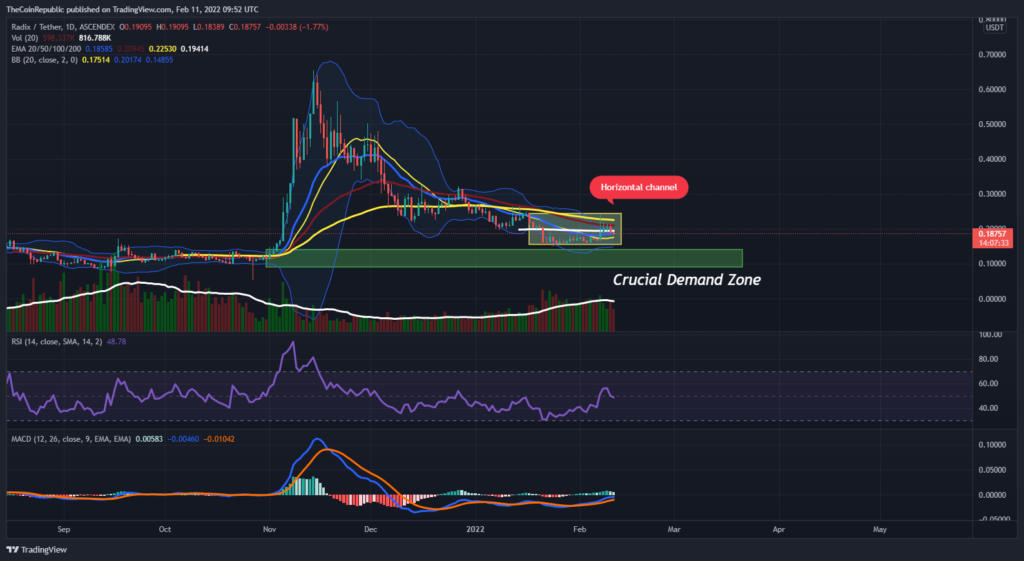
- Radix Coin consolidates in a horizontal range-bound area above the crucial demand zone.
- The crypto asset is trading above the 20 SMA line, and the coin is trying to head towards the 50, 100 and 200-days DMA to move out from the range-bound area.
- The pair of XRD/BTC is trading at 0.000004272 BTC with an intraday drop of 8.16%, whereas the XRD/ETH pair is CMP at 0.00005987 ETH with a 24-hour negative change of 7.04%.
XRD Coin Price trades above the crucial demand zone and consolidates inside a horizontal channel. The SRD coin is presently CMP at $0.18 and is trading negative by 9.93%. The trading volume in 24-hour is increasing from 33.61%. In contrast, volume to market cap ratio is 0.0005402, while the market cap value of the coin has decreased by 9.93%.
XRD crypto value has to move from the consolidation phase inside a horizontal channel. It’s been a while since it started consolidating in the horizontal channel. Investors have to wait for any directional change to reach any conclusion. Buyers and sellers are trying to get the coin out of the horizontal range-bound area.

– Advertisement –
XRD Coin is trading sideways over the daily chart, and traders are trying to get the coin out of the range-bound. It seems a strong upward trend or downward trend shall get the coin out from the consolidation phase. The trading volume on the chart can be seen below the average line, which needs to grow.
The XRD coin can be seen near the crucial demand zone. The coin struggled to get desired support which led the coin to consolidate over that region. The investors need to wait until the coin manages to get desired support and break out through the horizontal channel.
What do technical indicators suggest about XRD?

XRD Coin price over the daily chart is trading with sideways momentum. The technical indicators also suggest that the coin needs to move out from the channel to be either bullish or bearish.
Relative Strength Index forecast neutrality of the coin. RSI reflects the bearish to a sideways stage of the token.
MACD exhibits sideways as the MACD line moves parallel to the signal line. The MACD line appears to move towards zero, which may signify XRD moving towards the positive zone.
Conclusion
The XRD coin has to move out from the horizontal channel. It has to recover from the demand zone and for expected bounce-back. The technical indicators also reflect the sideways momentum of the coin. Traders need to wait for any directional change over the chart.
Technical Levels
Support Level: $0.14 and $0.10
Resistance Level: $0.31 and $50
Disclaimer
The views and opinions stated by the author, or any people named in this article, are for informational ideas only, and they do not establish financial, investment, or other advice. Investing in or trading crypto assets comes with a risk of financial loss.
Source: https://www.thecoinrepublic.com/2022/02/12/radix-price-analysis-xrd-coin-consolidating-in-a-horizontal-range-bound-of-0-15-and-0-20-what-now/
