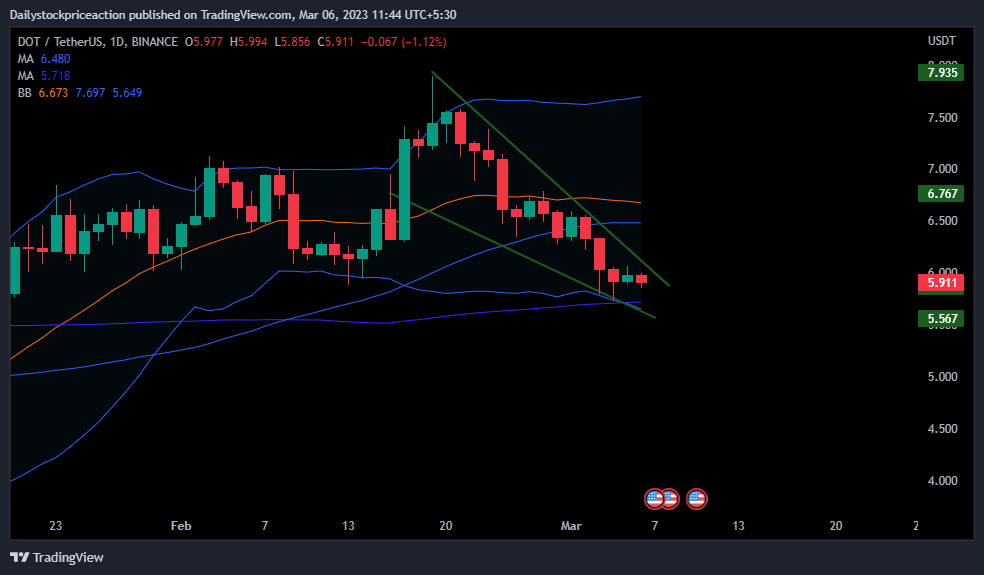
- DOT coin price is on a strong uptrend from the past couple of trading days, as it retest the 50 MA.
- DOT coin price is forming a falling wedge pattern on daily time scale.
- The pair of DOT/BTC is trading at the price level of 0.000263 with an increase of 1.48% in the past 24 hours.
DOT coin price, as per the price action, is showing a strong bullish momentum. Despite a brief fall in the overall cryptocurrency market the DOT coin price has managed to sustain at the demand zone. At present, the DOT coin price is trading at the price level of $5.917.
DOT coin price shows signs of reversal

DOT coin price as per the price action is on a strong uptrend. As of now, the coin price is trading at the long term demand zone. The coin price surpassed the important 50 and 100 Moving Averages. This comes after the coin price faced a strong bullish trend in the past month. Since then the coin price is trading above these MAs acting as a strong demand zone moving upwards.
As of now, the DOT coin price is trading at the lower band of the bollinger band indicator after failing to surpass the upper band. The coin price has gone past the 15EMA, indicating a short term demand zone. Volumes have increased as the coin price fell to the demand zone. It remains to see if the coin price will break the supply zone or fall below the demand zone.
SOL coin price is forming a falling wedge pattern on a daily time frame

Average Directional Movement Index is showing a bearishness when plotted on a daily time frame. This comes after the coin price failed to sustain at the supply zone as it fell to the demand zone. As of now, the ADX curve is transacting at the level of 22.32. As of now, the ADX curve has turned sideways indicating halt in the price movement and the possible change in the price structure.
Supertrend indicator has turned negative as the coin price fell to the demand zone. Previously, the supertrend indicator triggered a buy signal as soon as it broke the supply zone. By then the supertend buy in was acting as a strong demand zone. But the recent breakdown has changed the scenario as it forms a supertend sell line which will act as a strong supply zone moving upwards.
Conclusion: DOT coin price has shown tremendous strength despite a strong bearish pressure in the global markets. The technical parameters are indecisive as it trades neutral. It remains to see if the coin price will break the supply zone or fall below the demand zone.
Support: $5.7 and $5.1
Resistance: $6.1 and $6.5
Disclaimer
The views and opinions stated by the author, or any people named in this article, are for informational ideas only, and they do not establish financial, investment, or other advice. Investing in or trading crypto assets comes with a risk of financial loss.
Source: https://www.thecoinrepublic.com/2023/03/06/dot-coin-price-analysis-dot-coin-price-gives-bulls-hopes/
