The Stacks price seems to be taking a pause this week after reporting significant growth in the previous four weeks. Stacks crypto’s price is moving back and forth this week, suggesting increased volatility.
The daily chart shows that the STX crypto witnessed a price drop in the early sessions of the week. However, the buyers made a comeback in later sessions and seemed to be erasing the losses in later sessions of the week.
It indicates that the bears are making attempts to regain control of the trend and dump the price. However, the buyers seem to be entering after every dip, indicating more upside potential in the crypto.
The STX crypto was hovering near 2.88 USD at press time, recording a negative intraday development of 0.80%. The recent price analysis shows that the crypto took a rebound from the 20-day exponential moving average and closed in the green for the last two sessions.
The sellers seem to be dominating in the early morning session. However, the buyers may make a comeback in later sessions and try to maintain a gaining streak in the third session.
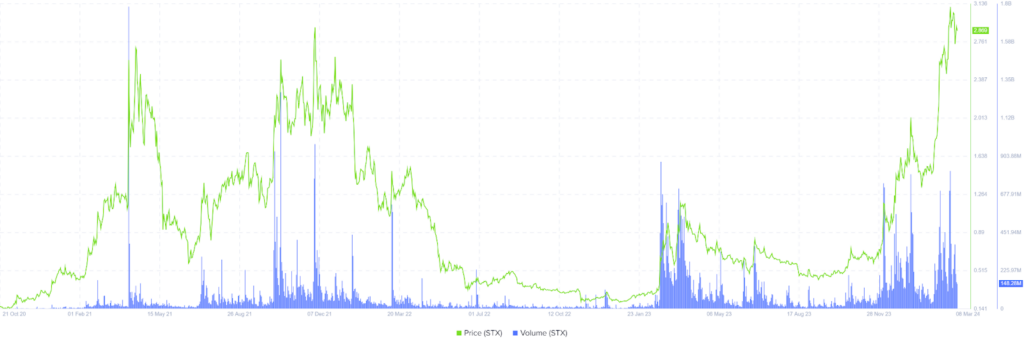
Stacks Crypto Volume Analysis
The volume analysis shows that the STX cryptocurrency has received $146.74 Million in volume, which is 20.43% less than the previous day. The price volume chart describes that volume inflow has been continuously increasing in recent sessions with an increment in the price.
It has a live market capitalization of $4.16 Billion. The STX crypto has a volume-to-market capitalization of 3.59%, indicating low volatility in the crypto.
It has a circulating supply of 1.44 Billion STX tokens against a total supply of 1.81 Billion tokens.
Stacks Price Indicator Analysis
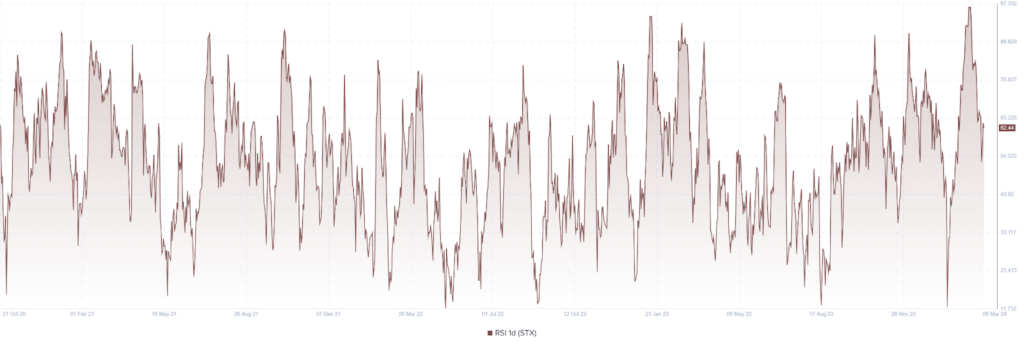
The technical indicators imply a bullish outlook above the key exponential moving average of 20, 50, and 200-day in the short and long term.
When writing, the RSI line was placed at 59.96 points, and that of the SMA line was placed at 68.56 points. Both the lines were hovering higher than the median line, suggesting a bullish outlook.
Moreover, a bearish crossover of both lines was observed on the charts, suggesting some sort of bearishness in Stacks crypto.
Stacks Price Vs Social Dominance

The increasing number of tweets mentioning STX highlight its growth and show that it is among the bruited topics of the month. The social dominance is rising along with an increment in the price, suggesting the increasing interest of users in Stacks.
Moreover, the number of tweets might be increasing due to any recent development in stacks crypto or any public figure’s direct or indirect involvement, as well as rumors.
How Does Volatility Compare with the Price?

The above-featured chart displays the comparison of volatility with price movement in the Stacks crypto. Careful observation of the chart shows that the STX crypto has witnessed significant growth in the recent sessions. However, the volatility has not increased on that scale, indicating the stability in the price.
The STX crypto seems comfortable at a higher price. It indicates that the sellers are on the backfoot, and the buyers may continue to pump the price at the higher levels.
Is There Any Change in the Development Activity in Stacks?

The Stacks crypto’s development activity chart saw an increase in the number of developers and development activity in 2021 and during the first quarter of 2022.
However, the number of developers and development activity in the stacks crypto witnessed a sharp decline after February 2022. It shows the development has taken a pause in the last couple of years and there has been no increase so far.
However, the price volume and market cap showed a significant pump, and the development has been constant at 4.71.
Stacks Crypto Forecast 2024
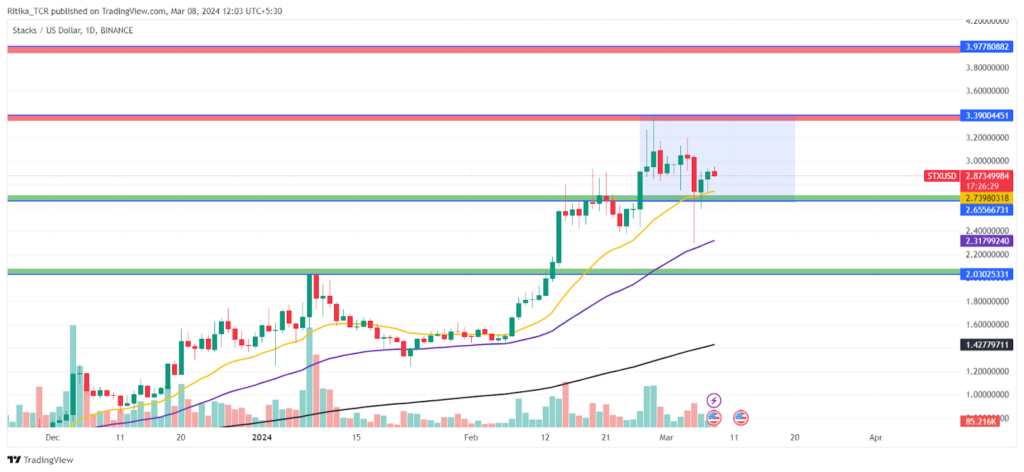
The short-term outlook lies above the key exponential moving averages on the bullish side. The 20-day and 50-day EMAs have been acting as dynamic support, and the price bounced back multiple times after retracing it.
Analysts’ short-term positive forecast assumes the STX price to attain highs of $3 and $4 as targets for March 2024. On the flip side, the bearish view of our analysts hopes for the price to break below the recent support of $2.5 on the lower side, below which more downside levels of $2.25 and $2 might be targeted.
Conclusion
The increasing number of tweets mentioning STX highlights its growth and shows that it is among the bruited topics of the month. Furthermore, the number of developers and development activity witnessed a sharp decline after February 2022 in the Stacks crypto, signifying that it has taken a pause in the last couple of years.
Therefore, the short-term positive forecast of the analysts assumes that the STX price may attain highs of $3 and $4 as the targets for March 2024.
Technical levels:
- Support levels: $2.64 and $2.03
- Resistance levels: $3.39 and $3.97
Disclaimer
The views and opinions stated by the author, or any people named in this article, are for informational purposes only and do not establish financial, investment, or other advice. Investing in or trading crypto or stock comes with a risk of financial loss.
Steve Anderson is an Australian crypto enthusiast. He is a specialist in management and trading for over 5 years. Steve has worked as a crypto trader, he loves learning about decentralisation, understanding the true potential of the blockchain.
Source: https://www.thecoinrepublic.com/2024/03/08/stacks-price-holds-higher-can-stx-crypto-surpass-4-in-march/