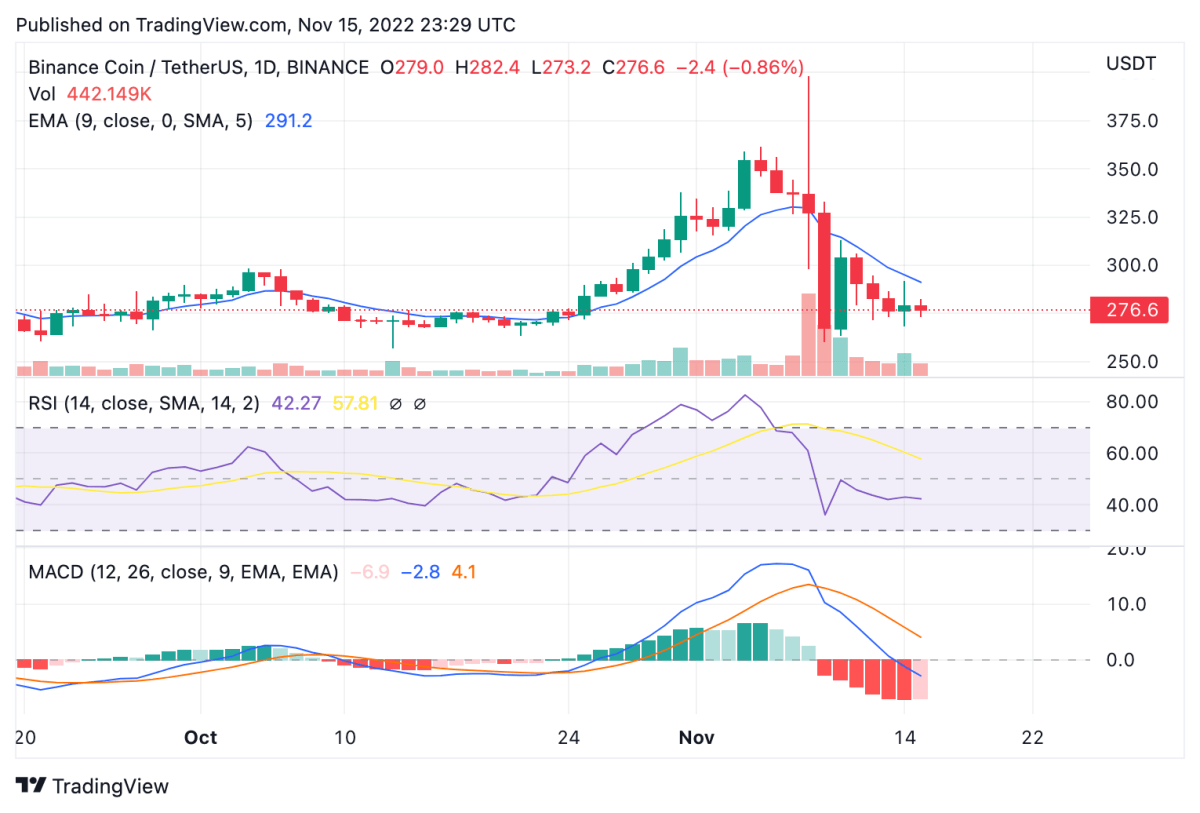
Binance Coin price analysis has turned bearish once again, after showing some positive momentum to push price up to $282.6 yesterday. BNB price failed to consolidate on the positive momentum from then and dropped down to $273.7 today, before rising up to $276 at the time of writing. BNB has been subject to significant decline since November 6, at a high of $360.2, and price has declined more than 23 percent since then. Over the next 24 hours, if bearish action is to continue and price fails to manoeuvre above the 9 and 21-day moving averages, Binance Coin could move down to test support at $250.
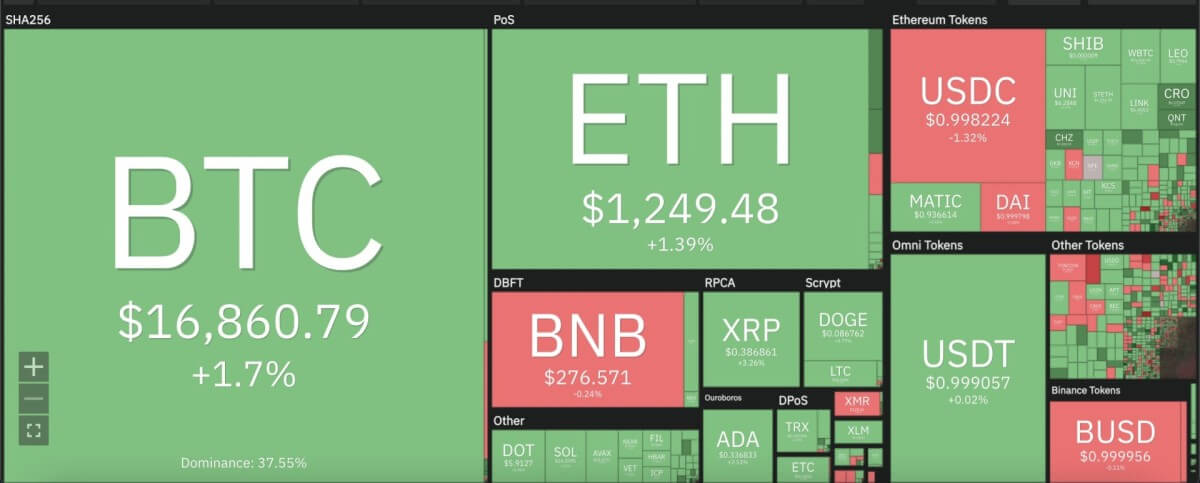
The larger cryptocurrency market showed mixed outcomes over the past 24 hours, as Bitcoin kept in touch with the $17,000 mark with a 2 percent increment, while Ethereum stayed above $1,200. Among leading Altcoins, Ripple rose 3 percent to move up to $0.38, whereas Cardano jumped up to $0.33 with a 2 percent rise. Meanwhile, Dogecoin consolidated up to $0.086 with a minor increment and Solana moved above the $14 mark with a 2 percent rise.

Binance Coin price analysis: BNB fails to break up to crucial moving averages on daily chart
On the 24-hour candlestick chart for Binance Coin price analysis, price can be seen following yesterday’s positive move upward with another turn downwards. Amidst a descending triangle pattern appearing on the daily chart, BNB price is set to move further south after failing to breach the 9 and 21-day moving averages, along with the 50-day exponential moving average (EMA) at $291. In a scenario where buyers could help price upwards at the current trend, resistance is likely to be met at $330. For that to happen, the $275 mark will need to be held to commence an upward movement.

Among other technical indicators, the 24-hour relative strength index (RSI) shows it could still put pressure on the bulls by crossing below the 60-level. The RSI currently sits at 42.30. The moving average convergence divergence (MACD) curve also continues to present a bearish divergence which can only be corrected once bulls halt the expected downward trend towards $250 support.
Disclaimer. The information provided is not trading advice. Cryptopolitan.com holds no liability for any investments made based on the information provided on this page. We strongly recommend independent research and/or consultation with a qualified professional before making any investment decisions.
Source: https://www.cryptopolitan.com/binance-coin-price-analysis-2022-11-15/