Recent Binance Coin price analysis indicates that the digital asset has retraced toward the $319.0 level after hitting a weekly high of $335.76.The BNB coin opened the daily trading session at $322.23 and is currently trading at $319.12, as per data from CoinMarketCap.The Binance coin is down by 0.09 percent which indicates the bears are trying to come into the market after a period of bullish dominance.
The Fibonacci retracement levels show that the immediate support for the BNB coin is at $316.0 and $311.8 respectively. The next major support level is found to be at $305.5 before the digital asset finds strong buying pressure around the $300 mark.
On the upside, Binance Coin faces resistance at $324.The current market sentiment is at a critical juncture whereby the bulls and the bears are battling for price control. Binance coin currently has a trading volume of around $999,207,773.42 and ranks position 4 in the overall cryptocurrency market.
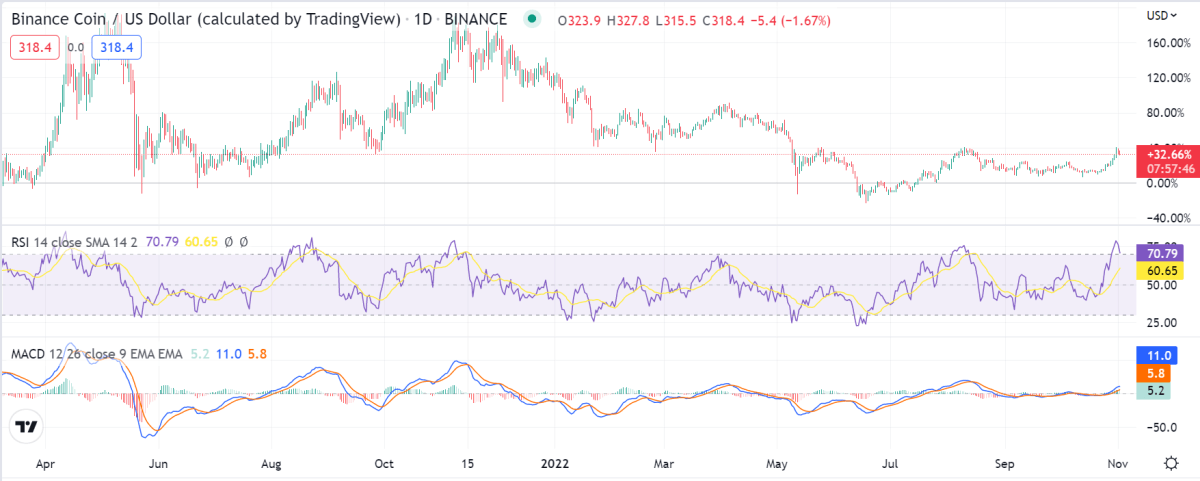
Binance Coin price analysis on a daily chart: Bulls dominate the market
Binance Coin price analysis on the daily chart indicates the BNB coin is facing a minor pullback after a period of bullish dominance. The digital asset has formed higher highs and higher lows which shows that buyers are in control.

The MACD indicator shows increasing bullish momentum as the moving averages move further apart. The RSI indicator also supports a bullish sentiment of above 71.0. The bulls are defending the key support level of $319 which if broken could pull the BNB price toward $311.
However, if the bulls continue to dominate and push the digital asset above $324, BNB could target resistance levels at $332 and $340 respectively.
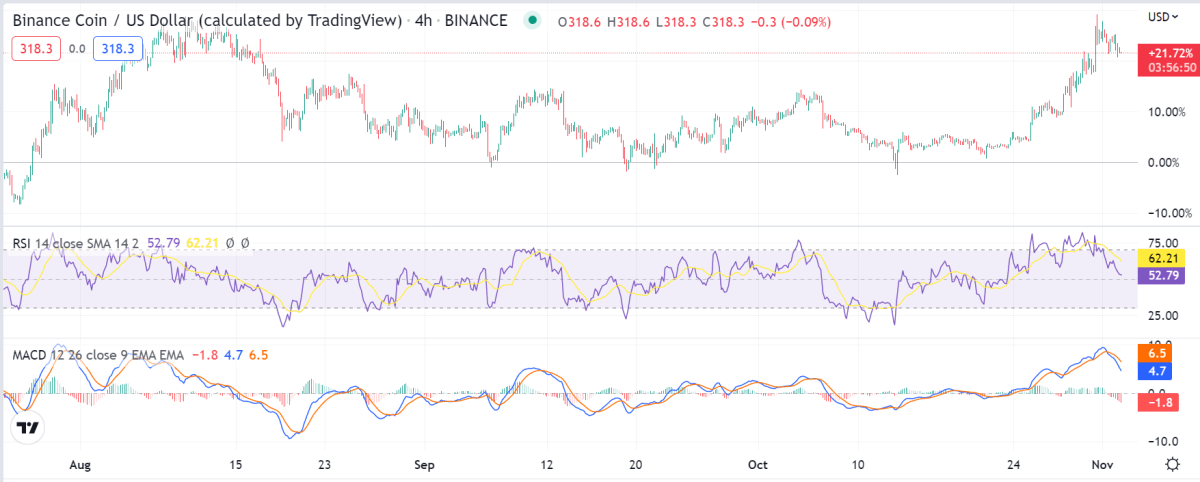
Binance Coin price analysis on a 4-hour chart: Bears try to gain control
Binance Coin price analysis on the 4-hour chart shows signs of bearish pressure as the digital asset consolidates below $320.The MACD indicator shows increasing bearish momentum with a decreasing gap between the moving averages. The RSI indicator also shows a bearish divergence below 66.0.

The moving average lines on the 4-hour timeframe are also showing a bearish crossover as the 50-period MA moves below the 100 and 200-period MAs.
Traders should keep an eye on key support levels at $316.0 and $311.8 in case of a further price pullback. On the upside, resistance levels are found at $324 and $332 respectively for the BNB coin.
Binance Coin price analysis conclusion
Overall, the Binance Coin price analysis suggests that the digital asset may face a minor pullback before finding strong buying pressure around the $300 level. However, if the bulls continue to dominate, BNB could target resistance levels at $332 and $340 respectively. The general outlook of the market is however bearish despite recent bullish dominance.
Disclaimer. The information provided is not trading advice. Cryptopolitan.com holds no liability for any investments made based on the information provided on this page. We strongly recommend independent research and/or consultation with a qualified professional before making any investment decisions.
Source: https://www.cryptopolitan.com/binance-coin-price-analysis-2022-11-02/
