Blockchain is still in the beginning stage of development, with miles to go to reach its actual potential. The growing demand for this technology proves that businesses have already recognised the relevance of this technology.
The Blockchain Market Report 2023 brings you a clear picture of the present state of the market. It will help you understand the pace of the technology’s growth. Let’s read the report, meticulously developed by Coinpedia.
1. Blockchain Market 2023: General Outlook
As of December 2023, the global blockchain market is on the verge of achieving its $17.21 billion target. This surge is fueled by companies offering blockchain technologies, showing a promising trend. Predictions suggest a continuous rise, aiming for $99.37 billion by 2027, growing steadily at 55.0% annually. Looking ahead to 2029, the global blockchain industry is anticipated to reach a substantial $163.83 billion.
Notably, North America leads in blockchain spending, followed by Western Europe. The banking sector stands out as the top industry investing significantly in blockchain technologies.
1.1. Factors that Contribute Towards the Surge in Demand for Blockchain
The global surge in demand for blockchain technology is fueled by a convergence of influential factors:
- Cryptocurrency Momentum
The surge in cryptocurrency usage underscores the growing importance of blockchain technology. With over 22,900 cryptocurrencies globally, daily Bitcoin transactions hit 40.5 million by June 2023, while Ethereum records over 1.193 million daily transactions since February 2021.
Decentralised Finance growth exemplifies blockchain’s transformative impact on traditional financial systems, promoting decentralisation and inclusivity. DeFi’s Total Value Locked is approximately $42 billion, with over 58% of total DeFi liquidity residing in the Ethereum ecosystem.
The synergy of Artificial Intelligence with blockchain introduces innovative possibilities, augmenting the technology’s capabilities.
The Non-Fungible Token trend adds a distinctive layer to the blockchain, sparking interest and adoption in creative and digital realms. Anticipated NFT revenue in 2023 is $3.55 billion, with a 22.82% CAGR, projecting $8.07 billion by 2027. Average user revenue is forecasted at $70.46 in 2023, with the United States leading with $1.005 billion. NFT users are expected to reach 64.45 million by 2027, with a global penetration increase from 0.7% to 0.8%.
- Blockchain as a Service (BaaS)
BaaS represents a convenient and scalable method, promoting wider access and adoption of blockchain solutions. The global BaaS market is expected to surge from $1.4 billion in 2022 to a projected $121.7 billion by 2032, with a remarkable 57.1% CAGR between 2023 and 2032, as per Acumen Research and Consulting.
- Decentralised Applications
The ascent of decentralised applications underscore the demand for blockchain solutions in contemporary tech ecosystems. In 2022, the Dapp sector saw a 50% surge in daily unique active wallets (dUAW), rising from 1.58 million in 2021 to an average of 2.37 million.
- Diverse Industry Applications
Blockchain’s versatility apans sectors such as BFSI, retail, manufacturing, and healthcare, driving broad adoption. In BFSI, 96% of experts see blockchain as mainstream. Manufacturing’s blockchain growth is projected at 73% from 2023 to 2026. Additionally, 52% of business experts anticipate blockchain becoming essential for customer identity verification in the future.
- Data Protection Awareness
Growing awareness of data protection, driven by cyber threats like malware, propels blockchain’s adoption as a safeguard mechanism.
Industries embracing digital transformation leverage blockchain for heightened data security and operational efficiency.
Global governments recognise blockchain’s potential. Since 2017, both governments and companies have incrementally raised their investment in blockchain solutions, reaching $11.65 billion in 2022. The United States led, spending $4.2 billion, with Western Europe counterparts close behind at $2.9 billion.
2. Blockchain Spending: A Basic Analysis
Global blockchain spending is projected to hit $19 billion by the close of 2024.
2.1. Top Blockchain Spenders By Region in 2023
| Region | Spending (Billion USD) | Percentage |
| USA | $4.2 | 22.1% |
| Western Europe | $2.9 | 15.3% |
| China | $1.4 | 7.4% |
| Japan | $0.75 | 3.9% |
| Middle East & Africa | $0.50 | 2.6% |
| Others | $1.9 | 10.0% |


The USA emerges as the leading spender, allocating $4.2 billion, constituting 22.1% of the overall expenditure. Western Europe follows closely with $2.9 billion, contributing 15.3%. China allocates $1.4 billion (7.4%), Japan spends $0.75 billion (3.9%), and the Middle East & Africa invests $0.50 billion (2.6%). Other regions collectively spend $1.9 billion, accounting for 10% of the total.
2.2. Top Blockchain Spenders By Industry in 2023
| Industry | Percentage |
| Banking | 29.70% |
| Process Manufacturing | 11.40% |
| Discrete Manufacturing | 10.90% |
| Professional Services | 6.60% |
| Retail | 6.00% |
| Others | 35.40% |

Banking leads with a significant 29.70%, followed by process manufacturing at 11.40% and discrete manufacturing at 10.90%. Professional services and retail contribute 6.60% and 6.00% respectively. This distribution reflects the diverse adoption of blockchain technology, with the banking sector taking a prominent position in global expenditure, while various other industries also invest significantly, showcasing the broad impact and relevance of blockchain across different sectors.
3. Top Application Domains for Blockchain in 2023
| Application Domain | Percentage |
| Digital Currency | 33% |
| Data Access and Sharing | 32% |
| Data Reconciliation | 31% |
| Identify Protection | 31% |
| Payments | 30% |
| Track-and-Trace | 27% |
| Asset Protection | 27% |
| Asset Transfer | 25% |
| Certification | 23% |
| Record Reconciliation | 23% |
In 2023, the top application domains for blockchain are led by Digital Currency at 3%, showcasing its primary role. Following closely are Data Access and Sharing (32%), Data Reconciliation (31%), and Identity Protection (31%). Payments (30%) and Track-and-Trace (27%) also play significant roles. The technology’s versatility is evident in applications like Asset Protection (27%), Asset Transfer (25%). This diverse utilisation highlights blockchain’s pivotal role in enhancing security, transparency, and efficiency across various sectors.
4. Top Blockchain Trends & Predictions in 2023
- Blockchain’s Commercial Value
Expected to generate over $3.1 trillion by 2030, showcasing its extensive impact on global business and industries.
- Healthcare Blockchain Adoption
Anticipating a 55% adoption rate of blockchain applications in healthcare by 2025, emphasising its transformative role in the industry.
The NFT market value reaching $946 million in January 2030, signifying the continued growth and significance of non-fungible tokens.
- Central Bank Digital Currencies
Over 20 countries planning to introduce central bank digital currencies in 2023-24, reflecting a global shift towards digital currency systems.
Internet of Things estimated at $1,463.2 billion by 2027, underlining its substantial economic value and widespread adoption.
- Decentralised Autonomous Organisation Credibility
A notable increase in DAOs, with 12,306 in April 2023, indicating growing trust and adoption of decentralised organizational structures.
5. Top Blockchains in 2023
Total Value Locked can help us identify the top players.
| Rank | Blockchain | Total Value Locked |
| 1 | Ethereum | $29,586,762,377 |
| 2 | BNB Smart Chain | $3,318,480,715 |
| 3 | Arbitrum One | $2,565,440,982 |
| 4 | Solana | $978,136,132 |
| 5 | Avalanche | $924,444,031 |
| 6 | Optimism | $922,344,708 |
| 7 | Polygon POS | $934,487,983 |
| 8 | Base | $318,265,940 |
The top eight blockchain on 11th December, 2023, based on Total Value Locked (TVL), features Ethereum as the leader with $29.6 billion. BNB Smart Chain and Arbitrum One follow, with $3.3 billion and $2.6 billion, respectively. Solana, Avalanche, Optimism, Polygon POS, and Base complete the top 8, demonstrating their substantial presence in the blockchain landscape. Ethereum’s dominance persists, while other platforms contribute to the diverse and growing ecosystem.
5.1. Blockchain Dominance Analysed
| Blockchain | Dominance % |
| Ethereum | 73.24% |
| BNB Smart Chain | 8.21% |
| Arbitrum One | 6.35% |
| Solana | 2.42% |
| Avalanche | 2.29% |
| Optimism | 2.28% |
| Polygon POS | 2.31% |
| Base | 0.79% |
| Others | 2.21% |

The above depicts the dominance percentage of the top blockchain in 2023. Etheruem leads with a substantial 73.24%, emphasising its significant presence. BNB Smart Chain and Arbitrum One follow with 8.21% and 6.35%, respectively, Solana, Avalanche, Optimism, Polygon POS, and Base contribute to the remaining dominance. The ‘others’ category represents a collective 2.21%, acknowledging the presence of additional blockchain networks. This breakdown illustrates Etheruem’s overwhelming dominance, while other platforms collectively contribute to a diverse and evolving blockchain landscape.
6. Blockchain Comparison 2023: Unveiling Unique Traits of Leading Networks
Discover the distinctive qualities of leading blockchain networks by exploring key metrics that define their success. From Adoption and Activity to Blockchain Security and Reliability, Network Efficiency and Scalability, Economic Performance, Stability and Resilience, to Community and Trust – these metrics provide a holistic view for comparison and understanding the strength of each network.
6.1. User Surge: Decoding Blockchain Adoption and Activity Trends
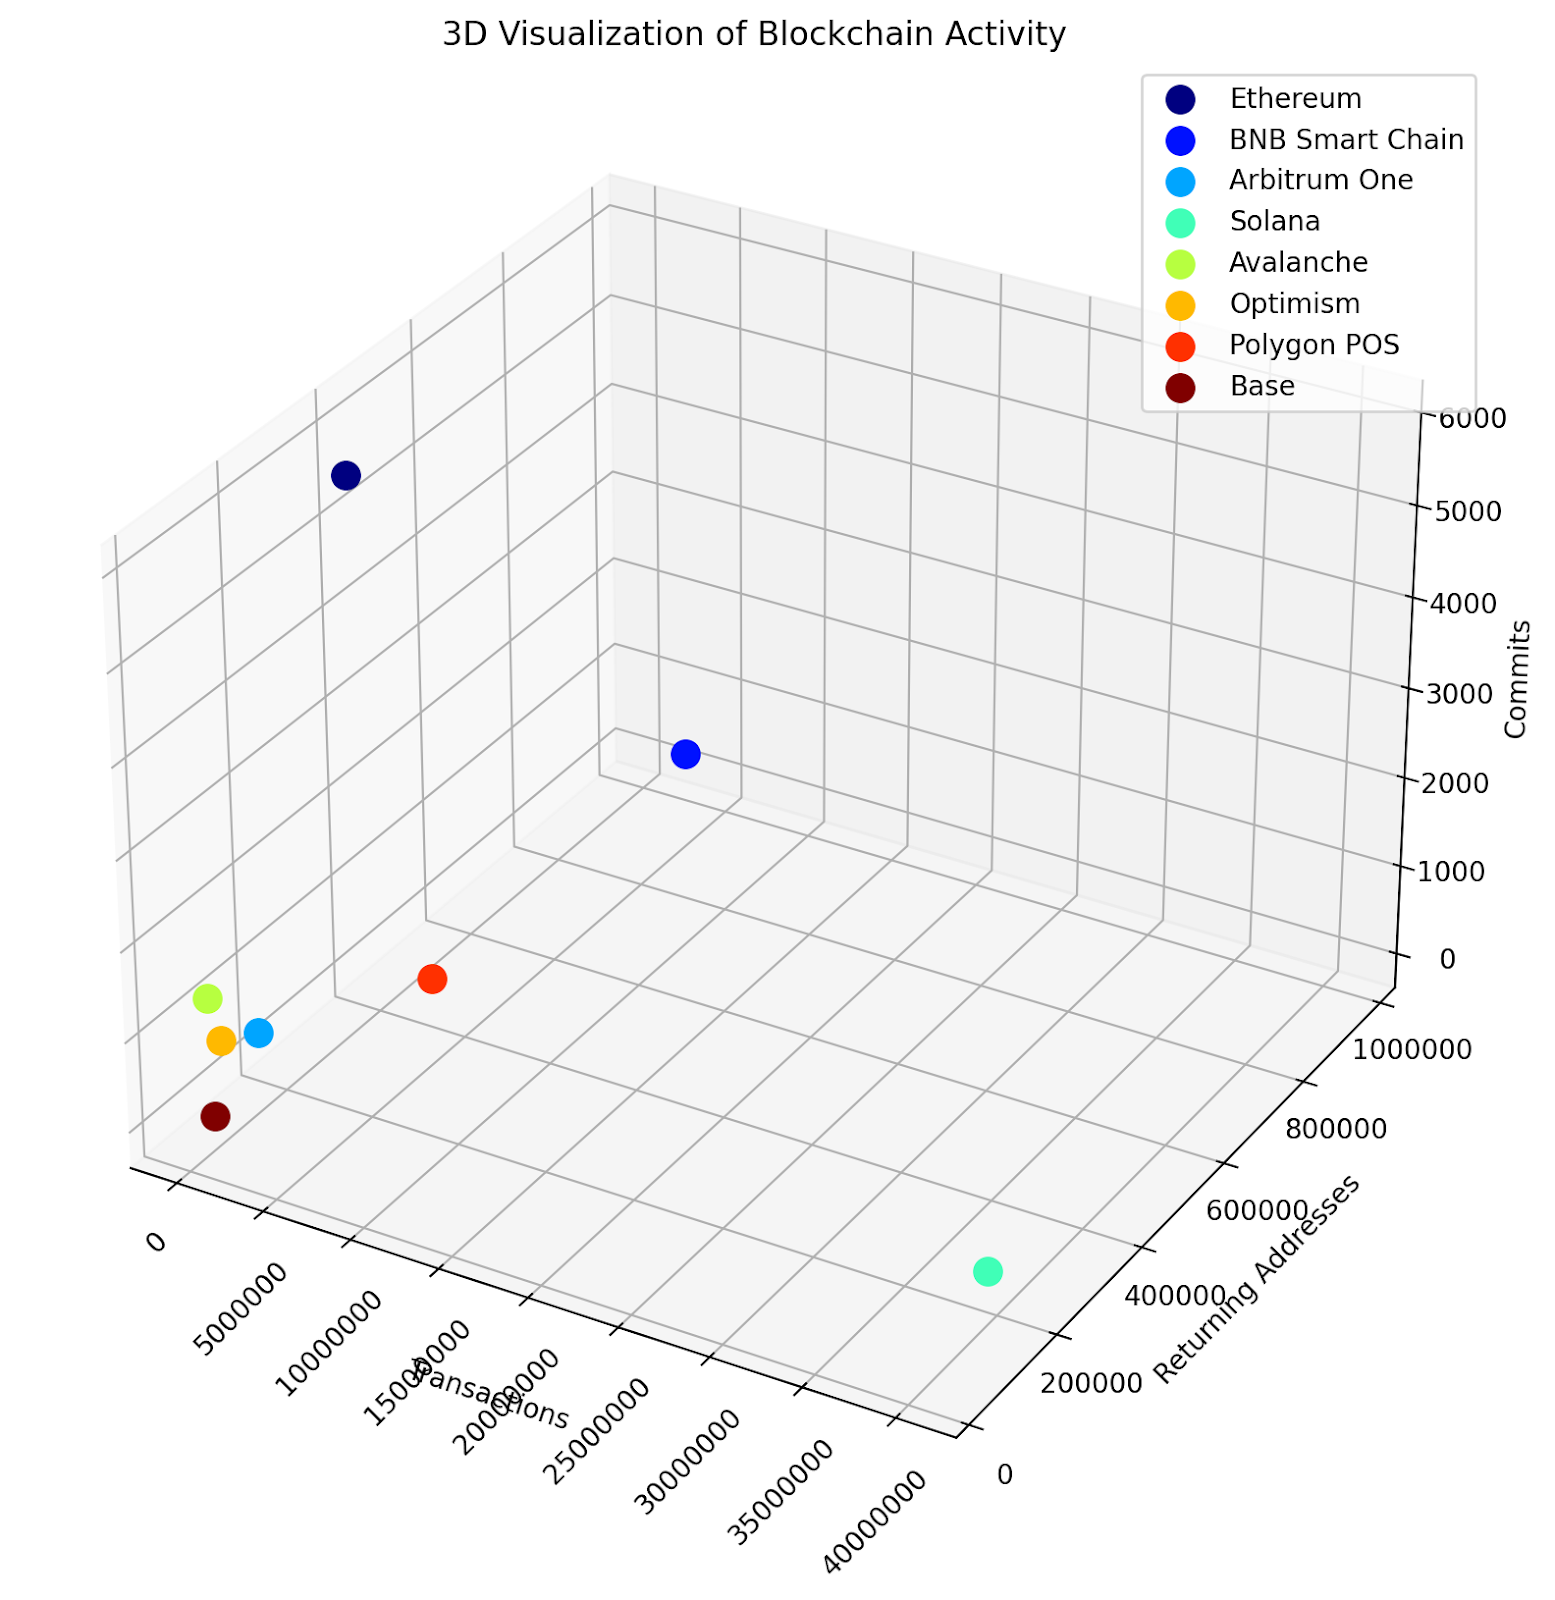
Comparing unique addresses, transaction volumes, and commits provides a comprehensive view of user adoption, activity and community involvement across these prominent blockchains.
| Blockchains | Returning Addresses | Transactions | Commits |
| Ethereum | 322.6K | 1.08m | 5.91k |
| BNB Smart Chain | 971.48k | 3.32m | 315 |
| Arbitrum One | 118.12k | 818.03k | 674 |
| Solana | 164.19k | 40.29m | 285 |
| Avalanche | 39.97k | 221.95k | 1.38k |
| Optimism | 61.86k | 278.66k | 815 |
| Polygon POS | 402.36k | 3.09m | 153 |
| Base | 45.8k | 231.35k | 35 |
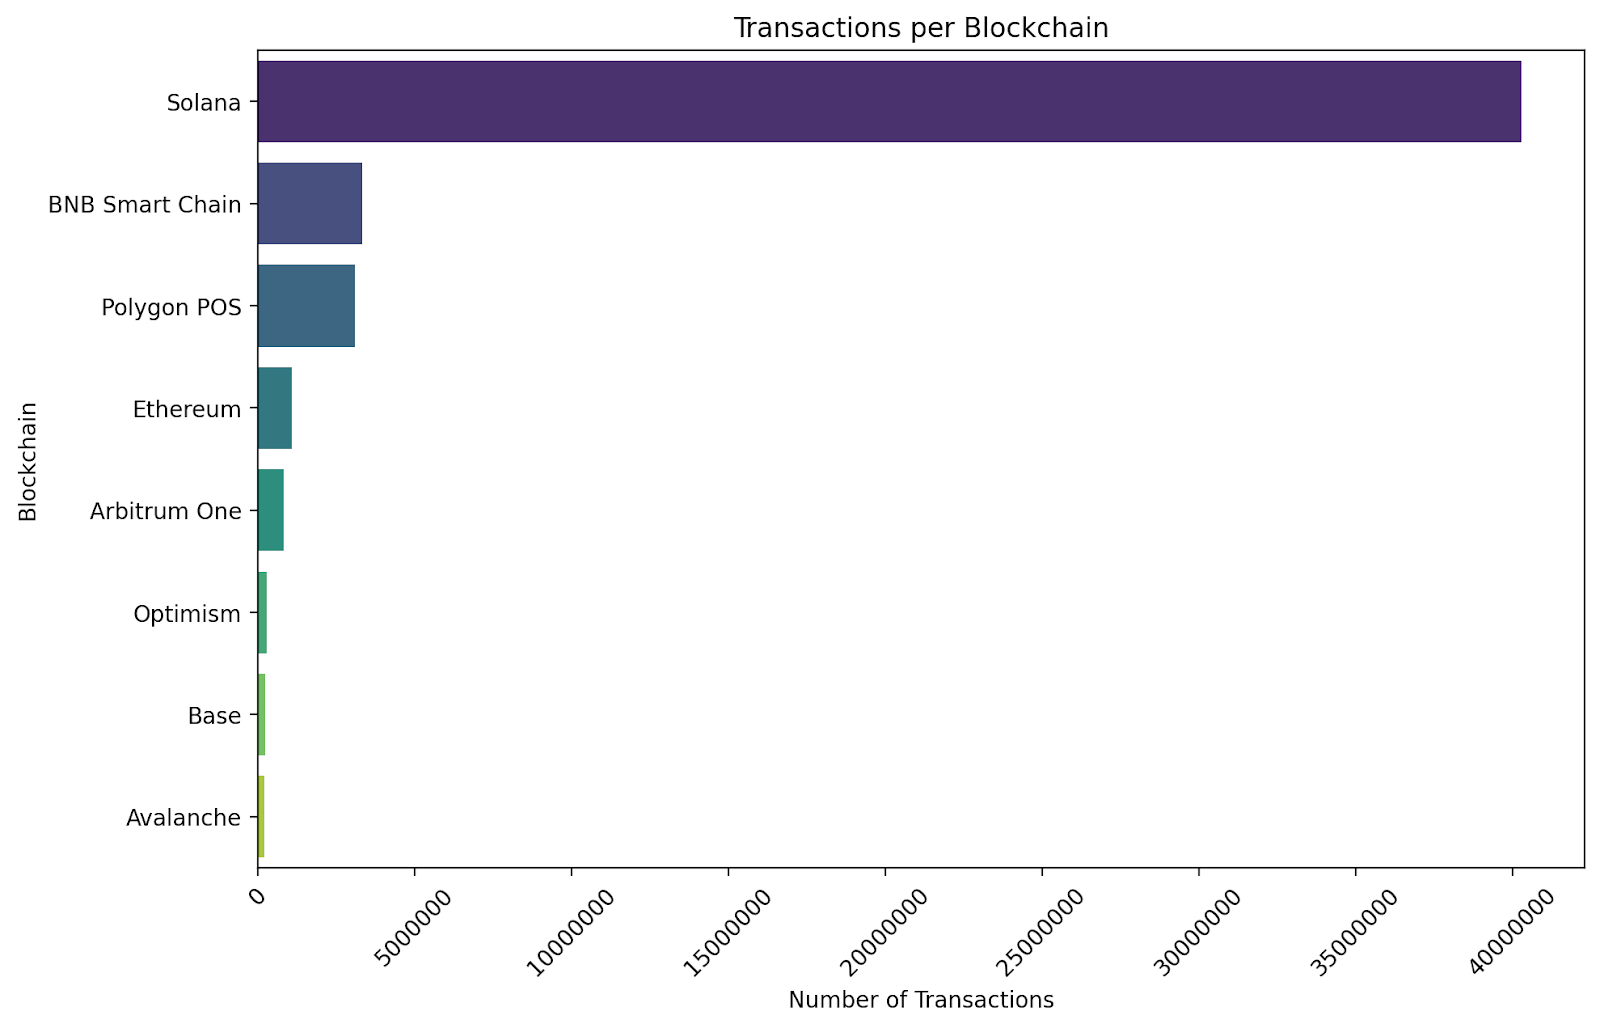
On December 1, 2023, assessing Adoption and Activity among various blockchains reveals distinct patterns. BNB Smart Chain emerges as a leader with 971.48K returning addresses and a staggering 3.32M transactions, signifying widespread adoption and higher user engagement. Solana follows suit, boasting 164.19K addresses and an impressive 40.29M transactions, indicating a vibrant ecosystem.
Ethereum, with 322.6K addresses and 1.08M transactions, maintains substantial activity, showcasing a well-established user base. Avalanche demonstrates moderate adoption with 39.97K addresses and 221.95K transactions. Optimism and Arbitrum exhibit healthy activity levels, with 61.86K and 118.12K addresses, respectively.
Considering code commits, Ethereum leads with 5.9K, reflecting continuous development and community involvement. BNB Smart Chain and Solana exhibit notable commitments with 315 and 285 commits, respectively. While each blockchain has its strength, BNB Smart Chain stands out in Adoption and Activity, illustrating a robust combination of user engagement and ongoing development as of Dec 1, 2023.
6.2. Trustworthy Tech: Unveiling Blockchain Security and Reliability Metrics
Examining the security and reliability of prominent blockchains involves a dual focus on commits and core developer strength.
| Blockchains | Commits | Core Developers |
| Ethereum | 5.91k | 252 |
| BNB Smart Chain | 315 | 25 |
| Arbitrum One | 674 | 29 |
| Solana | 285 | 28 |
| Avalanche | 1.38k | 33 |
| Optimism | 815 | 28 |
| Polygon POS | 153 | 12 |
| Base | 35 | 4 |
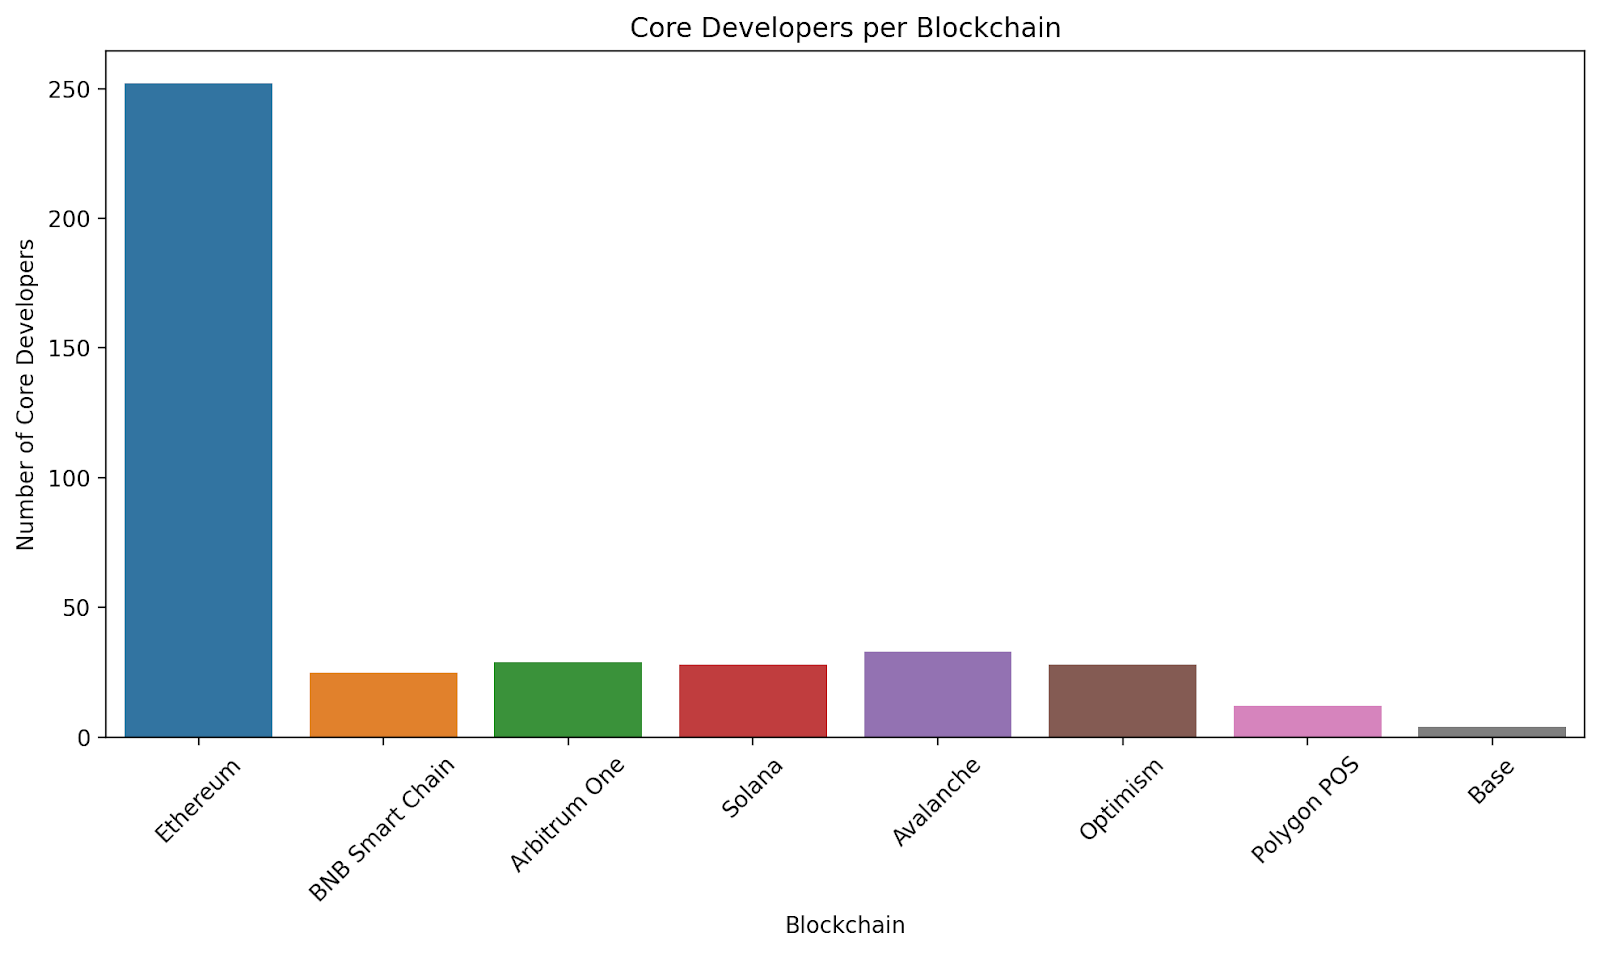
On Dec 1, 2023, assessing Blockchain security and reliability reveals significant variations among different blockchains. Ethereum boasts a robust position with 5.91K commits and a substantial developer team of 252, indicating a high level of ongoing maintenance and security measures.
Similarly, BNB Smart Chain demonstrates reliability with 315 commits and 25 core developers. However, the scale of Ethereum’s commitment and developer base exceeds BSC, suggesting Ethereum may have a more established and secure infrastructure.
In contrast, Arbitrum One exhibits a commendable balance with 674 commits and 29 developers, showcasing a diligent approach to security. Solana follows suit with 285 commits and 28 developers, positioning itself as a reliable blockchain. Avalanche impressively records 1.38K commits and 33 developers, indicating a strong commitment to security measures.
Optimism maintains reliability with 28 core developers and 815 commits. Polygon POS, with 153 commits and 12 developers, remains a weak contestant, compared to the rest. Lastly, Base, with 35 commits and 4 developers, stands as a smaller player.
Overall, Ethereum and Avalanche appear particularly strong in Blockchain Security and Reliability on Dec 1, 2023, showcasing a robust combination of committed development efforts and a sizable core developer team.
6.3. Scaling Success: Evaluating Blockchain Efficiency and Scalability
Network Efficiency and Scalability are assessed by examining transaction volumes and associated fees. A well-scalable blockchain maintains a balance between high transaction throughput and reasonable fees, indicating efficient and cost-effective operations.
| Blockchains | Transactions | Fees |
| Ethereum | 1.08m | 11.3m USD |
| BNB Smart Chain | 3.32m | 326.11k USD |
| Arbitrum One | 818.03k | 197.32k USD |
| Solana | 40.29m | 125.93k USD |
| Avalanche | 221.95k | 26.44k USD |
| Optimism | 278.66k | 100.37k USD |
| Polygon POS | 3.09m | 71.25k USD |
| Base | 231.35k | 62.56k USD |
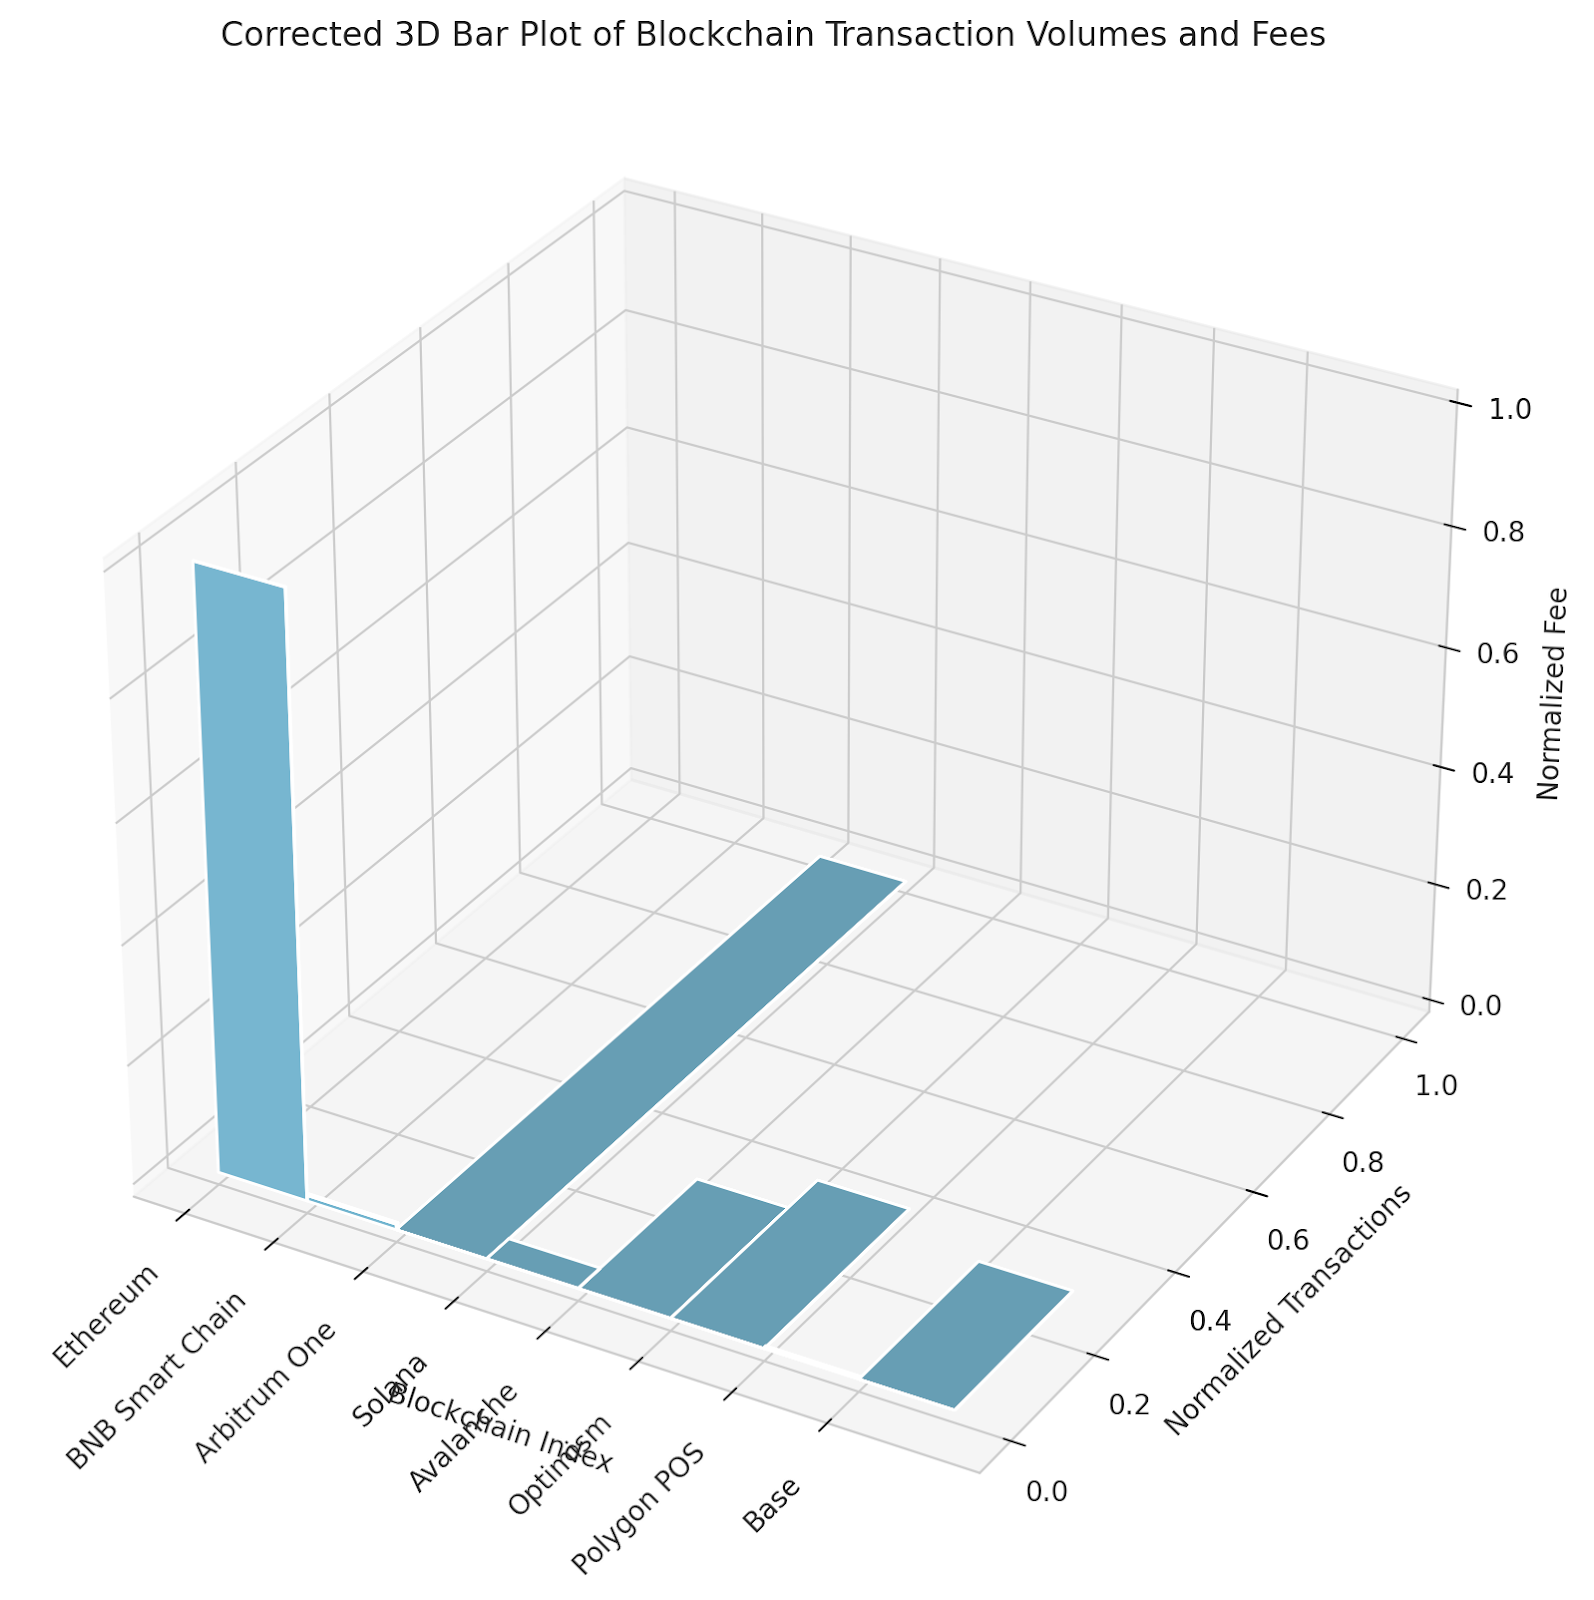
On December 1, 2023, BNB Smart Chain stands out in Network Efficiency and Scalability with 3.32m transactions and fees of 326.11k USD, showcasing its ability to handle a high volume of transactions at a relatively low cost. Solana follows closely with 40.29m transactions and fees of 125.93k USD, demonstrating efficient scalability. Ethereum, despite handling 1.08m transactions, incurs higher fees at 11.3m USD, suggesting potential scalability challenges. Avalanche, with 221.95k transactions and 26.44k USD in fees, displays moderate efficiency. Optimism and Arbitrum exhibit decent scalability with 278.66k and 818.03k transactions, respectively, and reasonable fees. The rest, including Polygon POS and Base, show varying degrees of efficiency.
Overall, BNB Smart Chain and Solana exhibit superior Network Efficiency and Scalability on December 1, 2023.
6.4. Beyond Price Tags: Navigating Economic Performance in Top Blockchains
Economic Performance can be assessed through Total Value Locked, trading volume, revenue, and native token price. TCL reflects the value secured, while volume, revenue, and price indicate economic activity, user engagement, and market perception.
| Blockchains | TVL | Volume | Revenue | Price |
| Ethereum | 26.705b USD | 1.065b USD | 9.86m USD | 2.05k USD |
| BNB Smart Chain | 2.971b USD | 277.23m USD | 32.61k USD | 227.6 USD |
| Arbitrum One | 2.178b USD | 363.56m USD | 40.26k USD | 2.05k USD |
| Solana | 653.92m USD | 200.58m USD | 63.63k USD | 59.1 USD |
| Avalanche | 664.94m USD | 79.38m USD | 26.44k USD | 21.4 USD |
| Optimism | 776.76m USD | 40.56m USD | 16.26k USD | 2.05k USD |
| Polygon POS | 834.62m USD | 137.62m USD | 40.72k USD | 0.8 USD |
| Base | 298.03m USD | 21.3m USD | 6.63k USD | N/A |
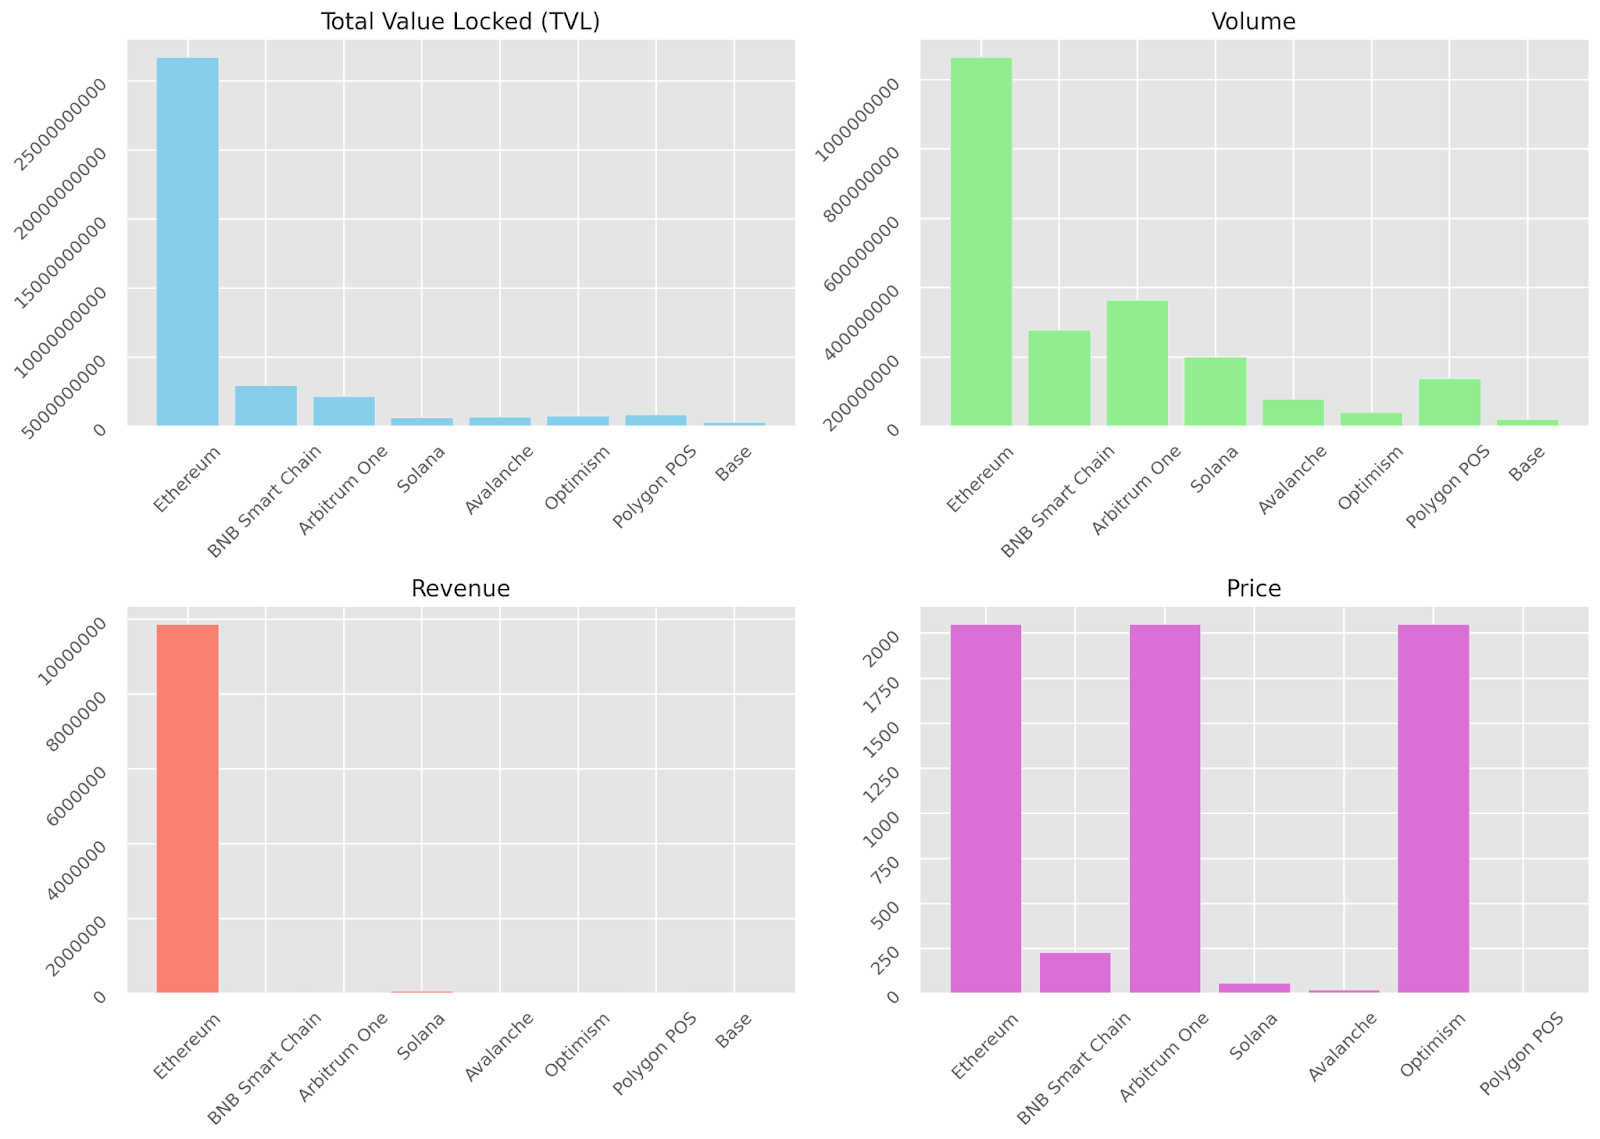
On December 1, 2023, Ethereum leads in Economic Performance with a TVL of 26.705b USD, showcasing substantial value secured. Despite having a lower TVL, BNB Smart Chain excels in trading volume at 277.23m USD, indicating vibrant economic activity. Arbitrum One follows closely with a TVL of 2.178b USD and a notable trading volume of 363.56m USD. Solana demonstrates a balanced performance with a TVL of 653.92m USD, trading volume of 200.58m USD, and a native token price of 59.1 USD.
Avalanche exhibits moderate economic performance with a TVL of 664.94m USD, trading volume of 79.38m USD, revenue of 26.44k USD. Optimism and Polygon POS show diverse strengths, with the former having a TVL of 776.76m USD and the latter excelling in revenue at 40.72k USD. Base, with a TVL of 298.03m USD, demonstrates economic viability.
While Ethereum leads in TVL, BNB Smart Chain, and Arbitrum One stand out in trading volume. Solana maintains a balanced performance, making it a notable contender. The choice among these blockchains depends on specific economic goals, whether securing value, fostering economic activity or capitalising on token value.
6.5. Built to Last: Understanding Blockchain Resilience and Stability
Stability and Resilience are assessed by examining net inflows and stablecoin market capitalisation. Net inflows indicate investor confidence, while stablecoin diversity and adoption reveal a hedge against volatility within the blockchain ecosystem.
| Blockchains | Net Inflows | Stablecoins Mcap |
| Ethereum | 33.54m USD | 66.282b USD |
| BNB Smart Chain | -2.29m USD | 4.999b USD |
| Arbitrum One | 3.84m USD | 1.902b USD |
| Solana | N/A | 1.539b USD |
| Avalanche | -1.18m USD | 1.047b USD |
| Optimism | -1.89m USD | 576m USD |
| Polygon POS | -5.91m USD | 1.207b USD |
| Base | 231.31k USD | 82.94m USD |
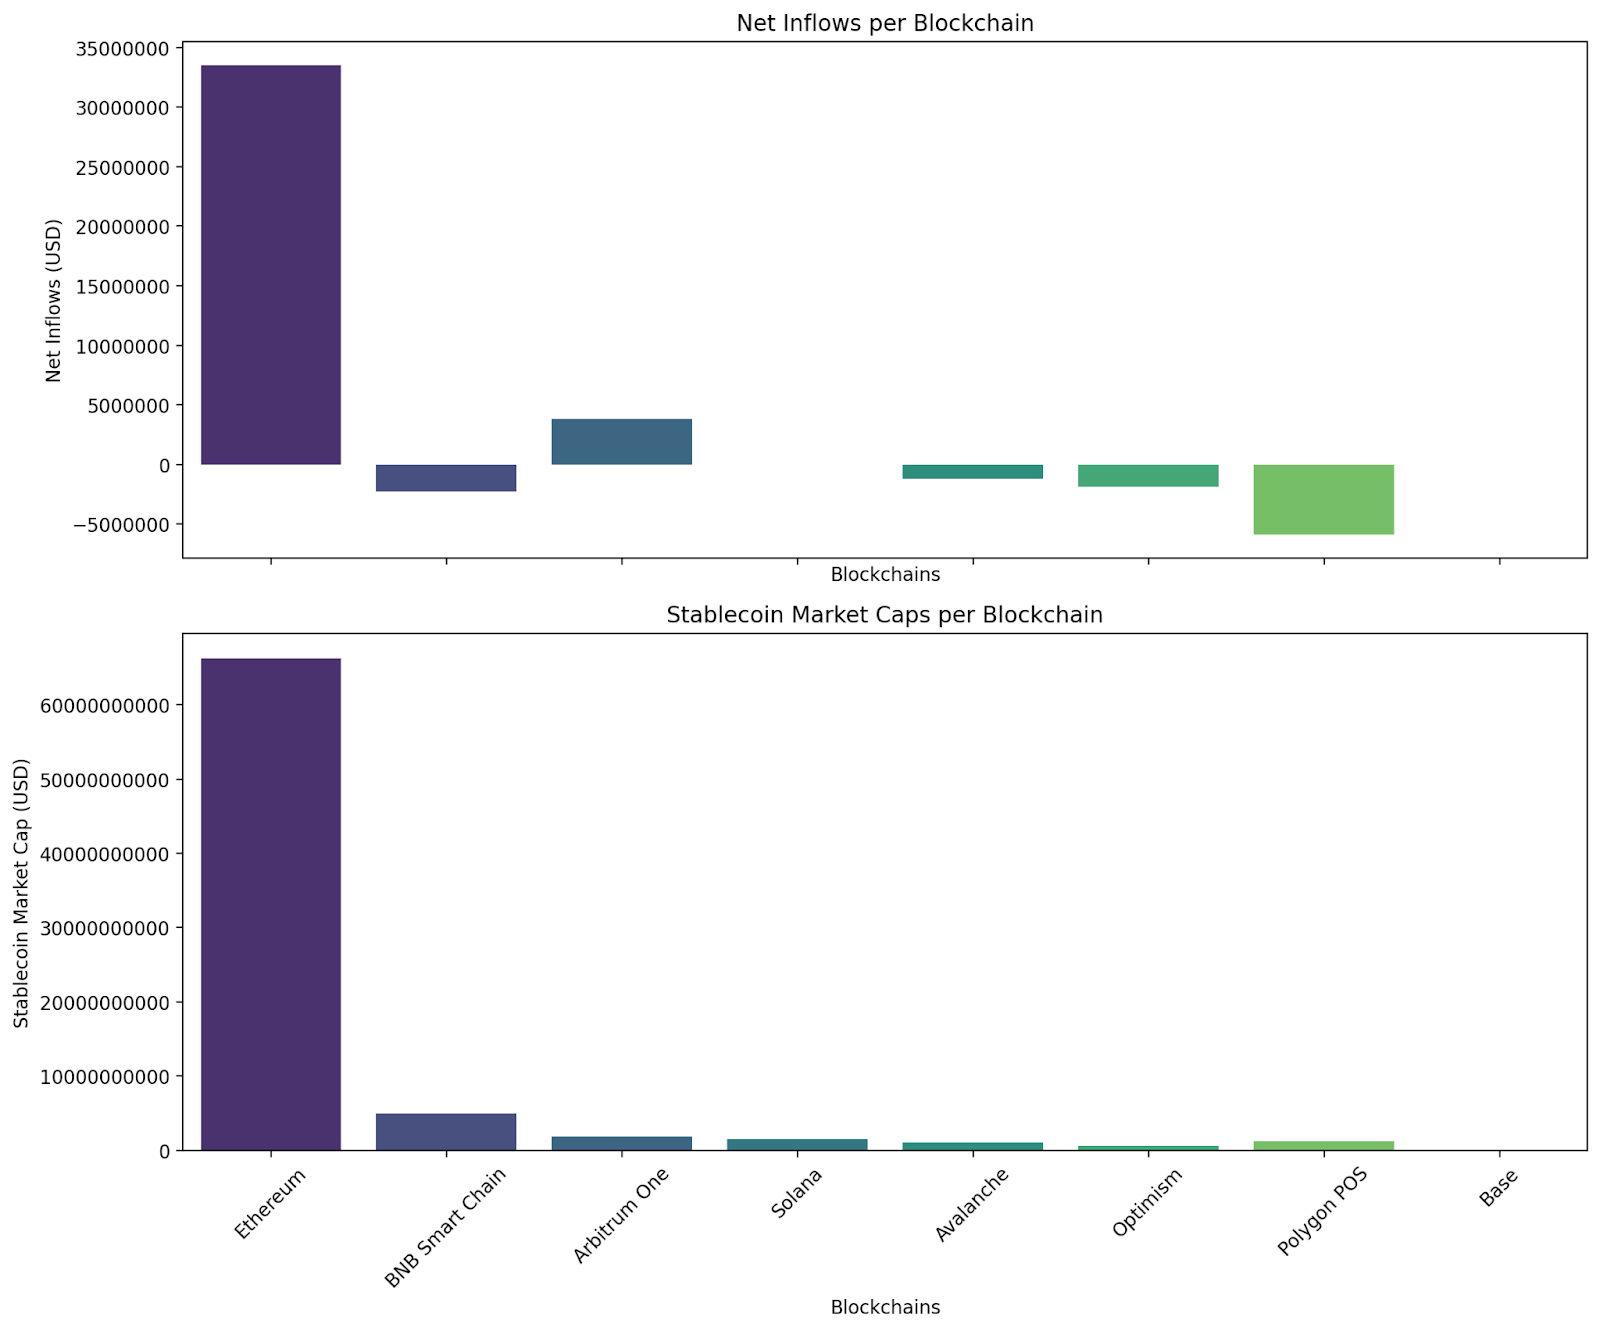
On December 1, 2023, Ethereum stands out in Stability and Resilience with net inflows of 33.54m USD, significantly positive investor confidence. BNB Smart Chain, despite negative net inflows of -2.29m USD, excels in stablecoin market capitalisation at 4.999b USD, showcasing resilience against volatility.
Arbitrum One displays a robust position with net inflows of 3.84m USD, indicating investor interest and confidence. Solana demonstrates stability with a stablecoin market cap of 1.539b USD. Avalanche and Optimism, with negative net inflows of -1.18m USD and -1.89m USD, respectively, reveal challenges in investor confidence.
Polygon POS, with a notable negative net inflow of -5.91m USD, faces challenges, but its stablecoin market cap at 1.207b USD showcases resilience. Base, with a positive net inflow of 231.31k USD, displays stability at a smaller scale.
Overall, while Ethereum shows strong stability with positive net inflows, BNB
Smart Chain excels in resilience with a substantial stablecoin market cap on Dec 1, 2023.
6.6. Community Plus: Analysing Trust and Perception in Blockchain Today
The easy way to assess Community Perception and Trust is by examining returning addresses, core developer presence and net inflows. The number of active users, committed developers, and positive inflows collectively reflects the community’s trust and confidence in a blockchain.
| Blockchains | Returning Addresses | Core Developers | Net Inflows |
| Ethereum | 322.6K | 252 | 33.54m USD |
| BNB Smart Chain | 971.48k | 25 | -2.29m USD |
| Arbitrum One | 118.12k | 29 | 3.84m USD |
| Solana | 164.19k | 28 | N/A |
| Avalanche | 39.97k | 33 | -1.18m USD |
| Optimism | 61.86k | 28 | -1.89m USD |
| Polygon POS | 402.36k | 12 | -5.91m USD |
| Base | 45.8k | 4 | 231.31k USD |

On December 1, 2023, Ethereum demonstrates robust Community Perception and Trust with 322.6k returning addresses and a substantial core developer team of 252. Positive net inflows of 33.54m USD further indicate investor confidence. BNB Smart Chain, with 971.48k addresses and 25 core developers, exhibits a strong community presence, though faces challenges with negative net inflows of -2.28m USD.
Arbitrum One showcases a growing community with 118.12k addresses and 29 core developers, coupled with positive net inflows of 3.84m USD. Solana, with 164.19k addresses and 28 core developers, reflects a stable and trusted community. Avalanche, despite a smaller community, maintains trust with 39.97k addresses, 33 core developers, and stable net inflows.
Optimism, with 61.86k addresses and 28 core developers, faces challenges with negative net inflows of -1.89m USD. Polygon POS, despite a larger community of 402.36k addresses, needs to address negative net inflows of -5.91m USD for enhanced trust. Base, with 45.8k addresses and 4 core developers, shows promise with positive net inflows of 231.31k USD.
Overall, Ethereum and BNB Smart Chain lead in Community Perception and Trust, with Ethereum showcasing a larger and more engaged community, while BNB Smart Chain excels in returning addresses. Arbitrum One and Solana also exhibit positive community trust, while others face challenges that need attention for improved perception and trust.
Endnote
In conclusion, the Blockchain Market Report 2023 provides a comprehensive overview of the industry’s dynamic landscape. With a projected market value set to soar to $12.21 billion in 2023, propelled by factors like cryptocurrency momentum, DeFI, NFTs, and government backing, blockchain continues its transformative journey. The report highlights the diverse applications across industries and regions, showcasing blockchain’s broad impact.
Notably, Etehruem leads the blockchain ecosystem with a dominant 73.24% share in Total Value Locked. As the technology evolves, the report forecasts significant trends, such as blockchain’s commercial value exceeding $3.1 trillion by 2030. This report serves as a valuable guide for understanding and navigating the burgeoning blockchain space.
Source: https://coinpedia.org/research-report/blockchain-industry-report-2023-growth-trends-and-projections/