
Disclaimer: The opinions expressed by our writers are their own and do not represent the views of U.Today. The financial and market information provided on U.Today is intended for informational purposes only. U.Today is not liable for any financial losses incurred while trading cryptocurrencies. Conduct your own research by contacting financial experts before making any investment decisions. We believe that all content is accurate as of the date of publication, but certain offers mentioned may no longer be available.
Contents
- Ethereum faces pressure
- Bitcoin is in tight range
XRP is currently hovering at a critical support level of $0.51, facing a period characterized by decreasing volume and technical uncertainty.
As we examine trading volumes, a decline can be seen, a sign that typically hints at stagnation. Further complicating the outlook is the threat of a “death cross” — a technical chart pattern where the 100-day EMA crosses below the 200-day EMA, often interpreted as a bearish signal for future price movements.
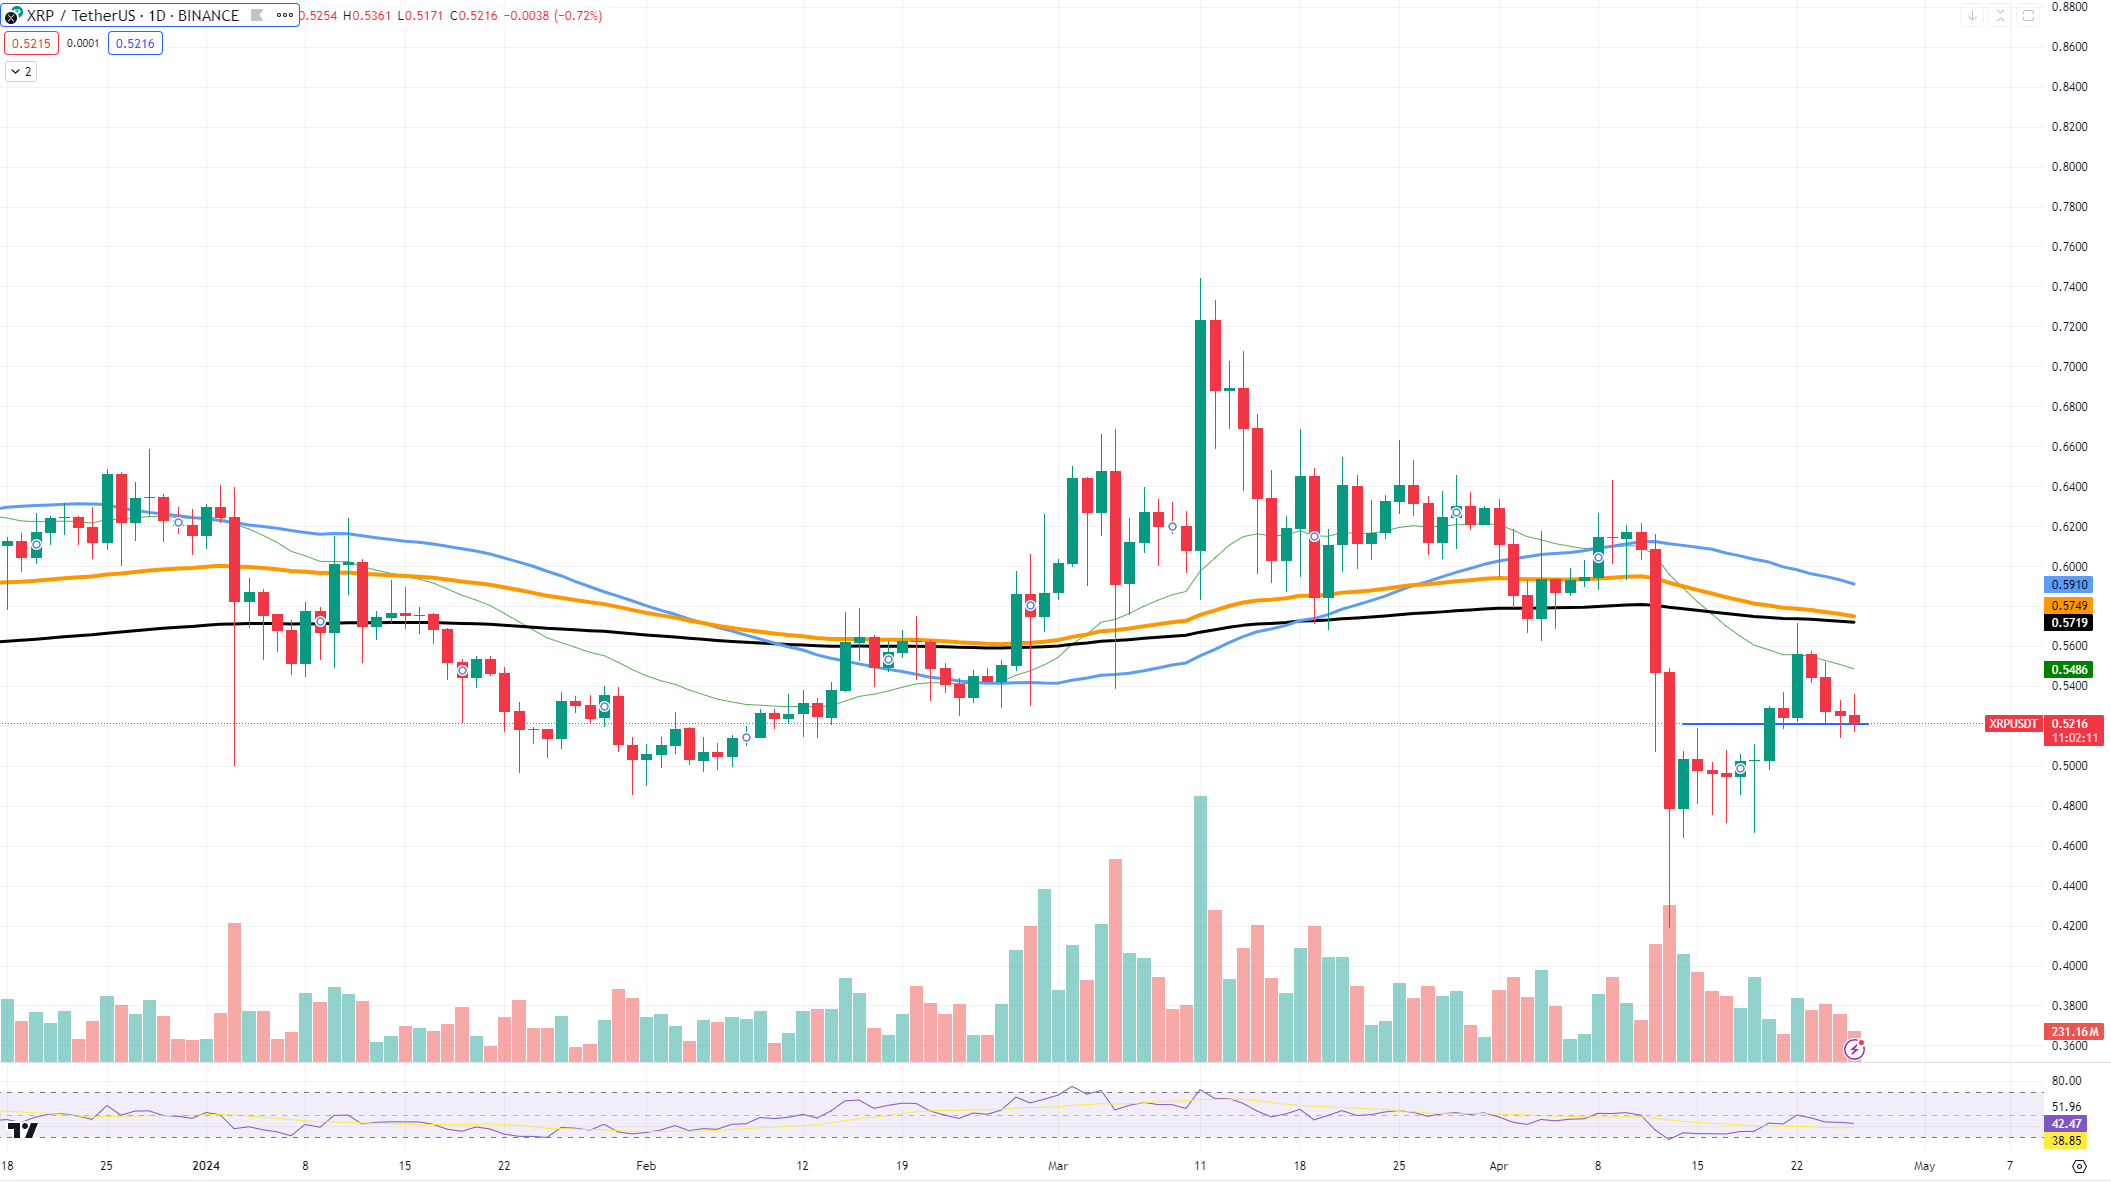
The RSI is currently below 50, suggesting that the market might be leaning toward bearish sentiment. While the current RSI level does not definitively set a bearish course for XRP, it certainly raises some concerns.
Looking more closely at the price chart, XRP’s ability to hold at the $0.51 support level is crucial; this level has historically served as a strong rebound point. However, there is significant resistance at $0.59, a point that has previously acted as a barrier to upward movements. Surpassing this resistance might pave the way to $0.75.
On the downside, if XRP fails to hold the $0.51 support, the next target could be the $0.45 support level, a point that marks the lows of previous major sell-offs. A drop to this level could intensify selling pressure, potentially leading to further declines.
Ethereum faces pressure
Things might turn around for Ethereum as recent patterns on the price chart hint at growing strength in its market trend. We have spotted the so-called “higher low” on the chart, which is when the price drops, but not as low as the previous fall, indicating a potential shift away from bearish sentiment. If Ethereum continues to create these higher lows, it could form a strong trendline to act as support.
Ethereum is reinforced by an ascending trading volume, a sign of increasing interest and a bullish indicator, meaning that more traders are getting involved and could potentially push prices higher.
Looking to the future, if Ethereum maintains this trajectory and its support holds firm, we might see it take aim at higher resistance levels. The next key resistance lies around $3,400, a breach of which could open up the path toward the $3,500 mark and beyond.
In this scenario, the newly forming trendline will help Ethereum’s price, providing that the buying momentum continues. This potential bullish phase would require sustained trading volumes and positive broader market sentiment.
Bitcoin is in tight range
Bitcoin is currently caught in a tight trading range, between its 50-day and 100-day EMAs. This technical situation can often foreshadow a surge in volatility, suggesting that Bitcoin could see significant price movements soon.
As of now, Bitcoin is trading between the 50-day EMA at approximately $64,000 and the 100-day EMA at around $59,500. These levels act as short-term resistance and support levels, respectively.
Adding to the potential for volatility is the declining trading volume observed in recent days. Lower volume indicates fewer transactions are occurring, which can sometimes lead to more dramatic price changes if a large order hits the market. This diminishing volume could also signal a decrease in investor interest or uncertainty about Bitcoin’s future direction, potentially leading to a substantial outflow from the asset.
If Bitcoin can sustain a breakout above the 50-day EMA, it might target higher resistance near the $70,000 mark. Conversely, a drop below the 100-day EMA could see it testing further support around the $50,000 level. These movements will be critical in determining Bitcoin’s direction in the short term.
However, if Bitcoin fails to maintain its position above the $65,500 support level, it could enter a bearish phase, potentially falling toward lower support at $59,000, exacerbated by the outflow of investments.
Source: https://u.today/xrps-uptrend-depends-on-this-052-level-ethereum-eth-about-to-enter-bullish-phase-bitcoin-btc