Bitcoin Analysis
Bitcoin’s price has been largely static for the last 7 trading days and is +0.57% over that time frame, at the time of writing. However, Monday was another small step backwards for bulls as BTC’s price concluded the day -$327.3.
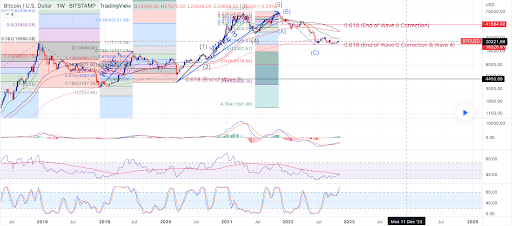
The BTC/USD 1W chart from sercanaktas is the first chart we’re analyzing for this Tuesday. Despite a pullback over the last two daily trading sessions, BTC’s price is comfortably trading above the $20k level and in between the 1.618 fibonnaci level [$18,326.91] and the 1 fib level [$30,409.02], at the time of writing.
Bullish BTC market participants want to push BTC’s price above the $21,700 level on the daily time frame so that an eventual retest of the 1 fib level on the weekly timescale can be achieved. The targets above the 1 fib level are 0.786 [$36,237.1], 0.618 [$41,584.92], and 0.5 [$45,806.36].
In defiance of bullish BTC traders are those shorting the Bitcoin market. They’re seeking to again retest the 1.618 fib level. Below that level the targets for bearish traders are 2 [$13,401.57], 2.618 [$8,076.86], 3.618 [$3,559.56] and finally the 4.764 fibonacci level [$1,391.86] in what would be an absolutely shocking scenario.
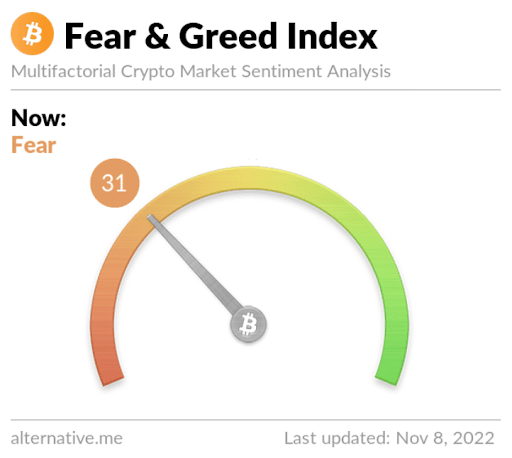
The Fear and Greed Index is 31 Fear and is -2 from Monday’s reading of 33 Fear.
Bitcoin’s Moving Averages: 5-Day [$20,559.84], 20-Day [$19,881.86], 50-Day [$19,796.45], 100-Day [$20,823.67], 200-Day [$29,014.78], Year to Date [$30,155.71].
BTC’s 24 hour price range is $20,384.9-$21,069.8 and its 7 day price range is $20,064.63-$21,417.69. Bitcoin’s 52 week price range is $17,611-$69,044.
The price of Bitcoin on this date last year was $67,526.
The average price of BTC for the last 30 days is $19,875.6 and its +3.1% over the same period.
Bitcoin’s price [-1.56%] closed its daily candle worth $20,588.8 and in red digits for a second day in a row on Monday.
Ethereum Analysis
Ether’s price also marked-down on Monday and sellers sent ETH’s price $3.57 lower for the day’s trading session.
The second chart we’re looking at today is the ETH/USD 4HR chart below by MonoCoinSignal. ETH’s price is trading between the 0.786 fib level [$1,540.96] and 0.618 [$1,570.88], at the time of writing.
Bullish BTC traders have yet to sustain themselves above the 0 fibonacci level [$1,689.95]. The path back to that level is to overcome the 0.618 fibonacci level followed by targets of 0.5 [$1,591.90], and finally, the 0.382 fib level [$1,612.92].
Bearish traders have controlled ETH’s price action for much of the last two days and they’ve targets below the 0.786 of 1 [$1,502.85] and 1.618 [$1,392.78].

Ether’s Moving Averages: 5-Day [$1,572.66], 20-Day [$1,429.77], 50-Day [$1,445.74], 100-Day [$1,459.39], 200-Day [$2,020.73], Year to Date [$2,118.42].
ETH’s 24 hour price range is $1,545.03-$1,608.04 and its 7 day price range is $1,508.91-$1,659.61. Ether’s 52 week price range is $883.62-$4,878.
The price of ETH on this date in 2021 was $4,808.09.
The average price of ETH for the last 30 days is $1,418.65 and its +17.04% over the same interval.
Ether’s price [-0.23%] closed its daily candle on Monday worth $1,567.46 and in negative figures for a third consecutive day.
Matic Analysis
On Monday, Polygon’s price was the clear outlier for project’s in the Top 10 and when the day’s candle was printed, MATIC’s price was +$0.121.
The final chart to conclude Tuesday’s price analyses is the MATIC/USD 1D chart below from imam9825. MATIC’s price continues to outperform the majority of the market over the last week and is +37.16% against The U.S. Dollar, +36.69% against BTC, and +37.74% against ETH, over the same stretch.
MATIC’s price is trading between the 23.60% fib level [$1.07] and 0.00% [$1.30], at the time of writing.
Bearish traders have clearly lost control over MATIC’s price as its +54.25% over the last 30 days and +41.05% for the last 90 days.
Those that still believe they can reverse MATIC’s price to the downside are targeting the 23.60% fib level followed by targets of 38.20% [$0.9285], 50.00% [$0.8116], 61.80% [$0.6946], and the 78.60% fibonacci level [$0.5281].

MATIC’s Moving Averages: 5-Day [$1.09], 20-Day [$0.921], 50-Day [$0.857], 100-Day [$0.80], Year to Date [$0.883].
Polygon’s 24 hour price range is $1.13-$1.29 and its 7 day price range is $0.841-$1.29. MATIC’s 52 week price range is $0.317-$2.92.
Polygon’s price on this date last year was $1.89.
The average price of MATIC over the last 30 days is $0.896 and its +48.96% for the same duration.
Polygon’s price [+10.67%] closed its daily session on Monday worth $1.258 and in green figures for the fourth time in five days.
Source: https://en.cryptonomist.ch/2022/11/08/bitcoin-ethereum-polygon-matic-price-analyses/