
Markets are now riding what seems a consolidation face as the global market cap records minimal movements. The global market cap rose by 0.02% to $2.33T as of press time while the trading volume dropped by 17% to $91.5B.
Bitcoin Price Review
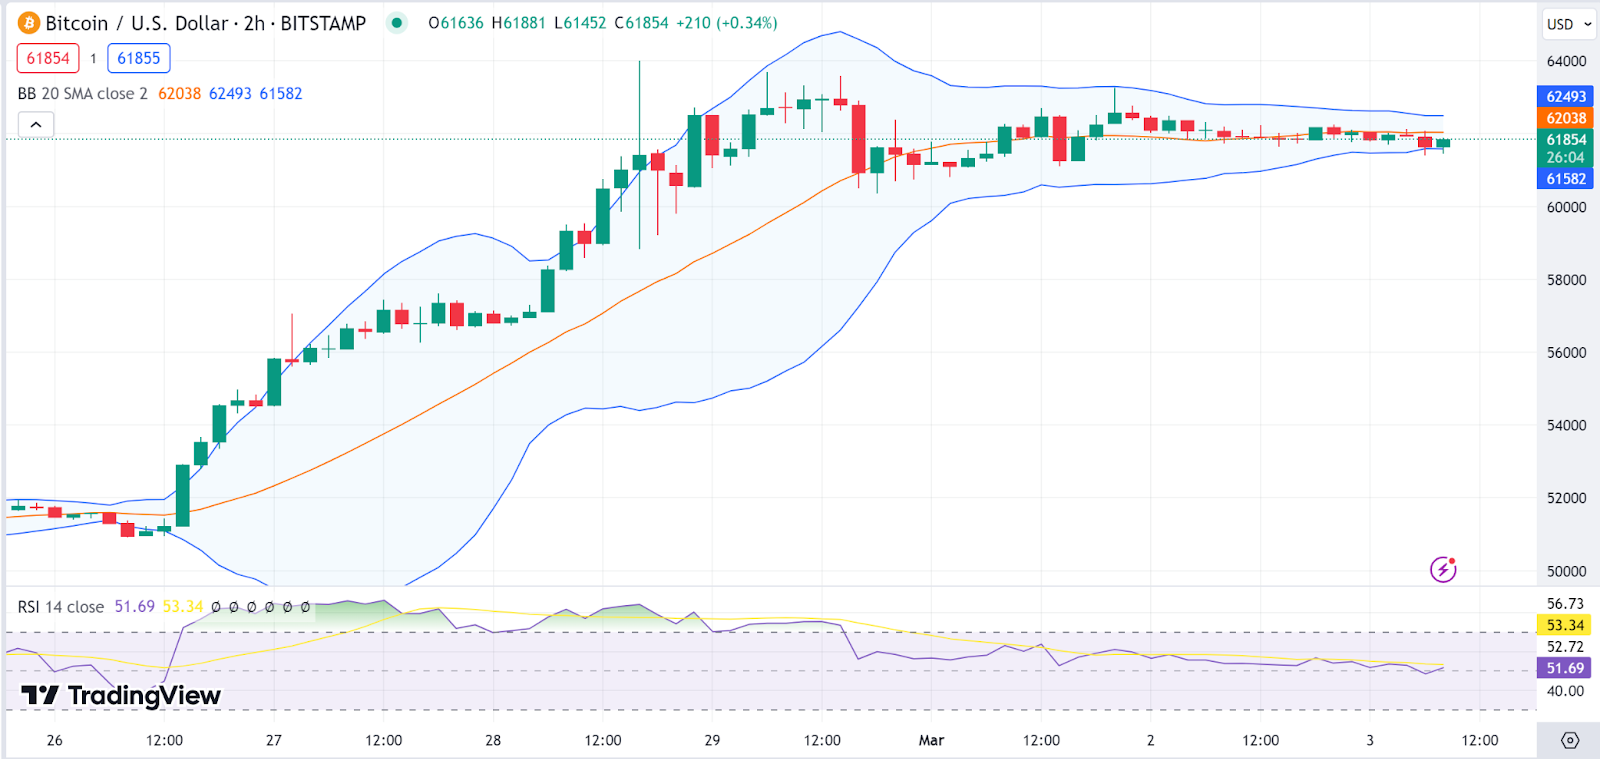
*BTC* chart shows that the Bollinger Bands are beginning to narrow, suggesting that volatility is decreasing, which can sometimes precede a significant price move as volatility reverts to the mean. The Bitcoin price is currently hovering around the short-term MA, showing some indecision in the market. The longer-term MA is below the Bitcoin price, which typically suggests an overall bullish trend.
The RSI is hovering just above the midpoint of 50, which generally indicates a lack of strong momentum in either direction. The current RSI level suggests a neutral market. The Bitcoin price has been fluctuating around the 20-period SMA of the Bollinger Bands, showing that the market is in a consolidation phase.

There isn’t a clear trend direction in the short term. The Bitcoin price stood at $61.7K as of press time, representing a 0.18% dump in the last 24 hours as the crypto king continues its consolidation phase.
Ethereum Price Review
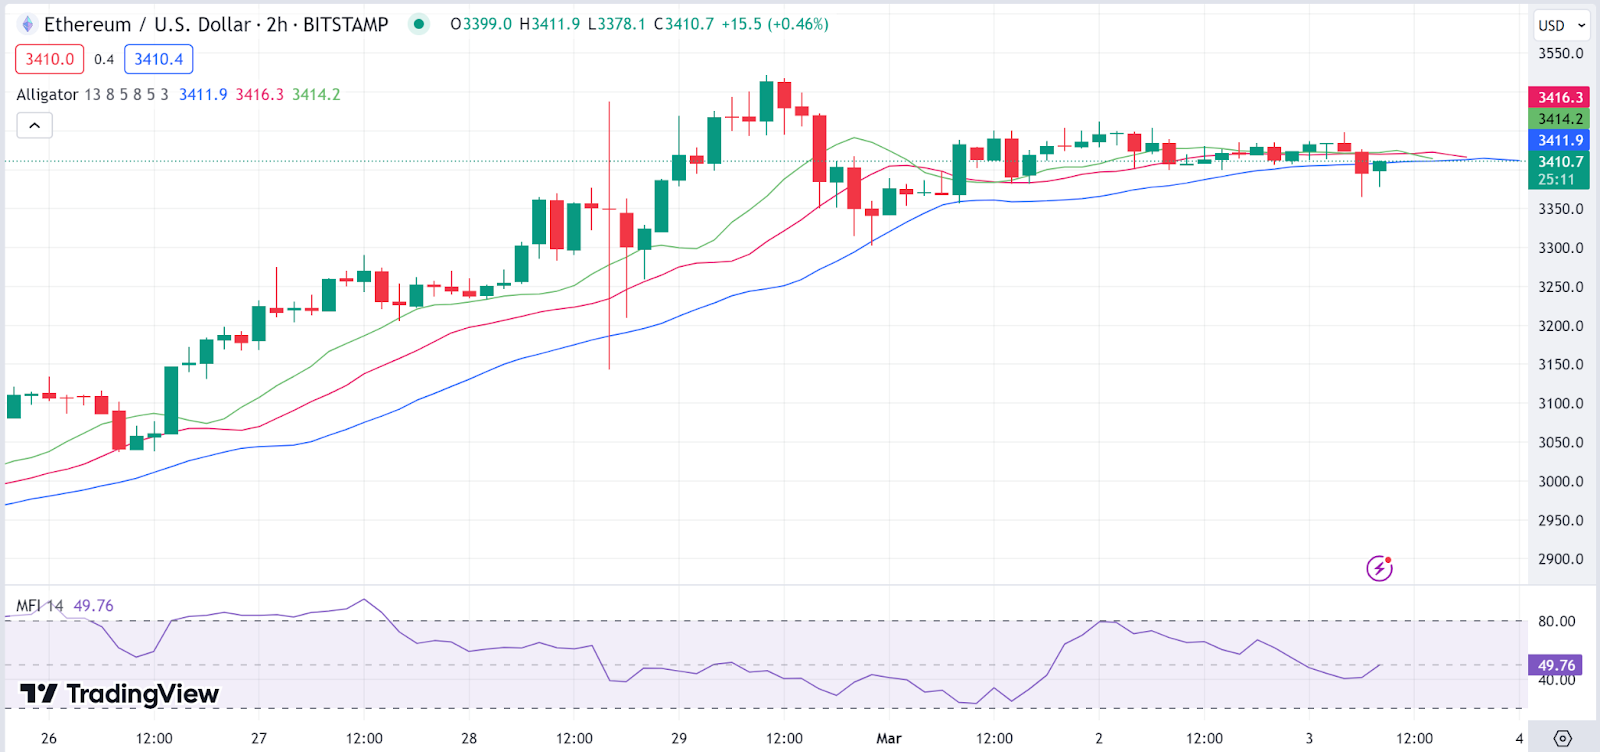
The *ETH* has been following an upward trend as indicated by the Alligator indicator, which is a collection of moving averages that suggest a bullish trend when the green line (lips) is above the red line (teeth) and the blue line (jaw).
The moving averages are beginning to converge and flatten out, which could indicate that the previous bullish momentum is losing strength and the market might be entering a consolidation phase or a possible trend reversal.
The Money Flow Index (MFI), which is at 49.76, is near the midline of 50. This indicates an equilibrium between buying and selling pressure, supporting the consolidation theory. A reading close to 50 often indicates a lack of clear direction in the market. The Ethereum price stood at $3407 as of press time, representing a 0.17% pump in the last 24 hours.
Arweave Price Review
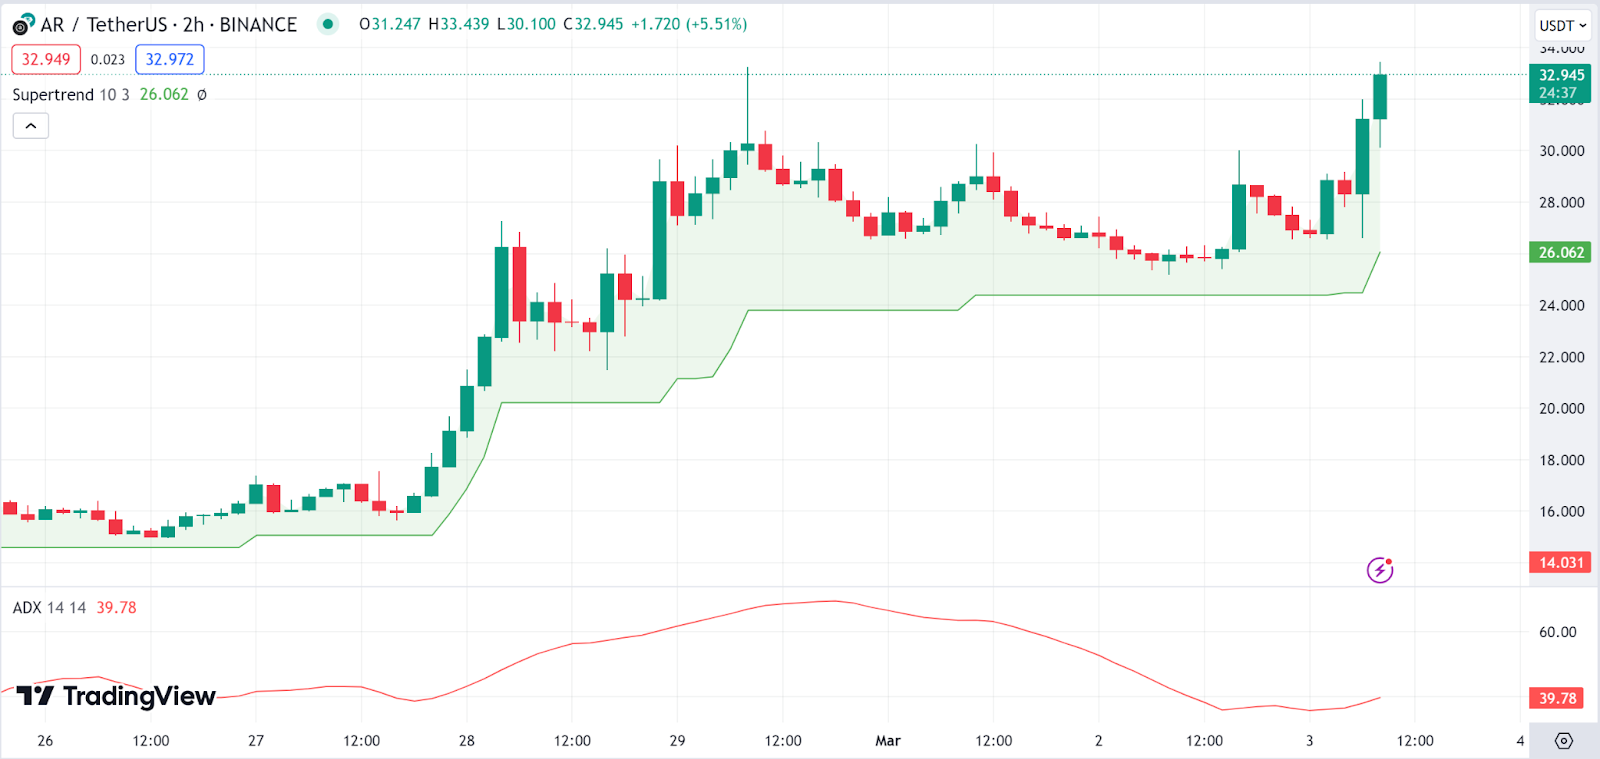
The Supertrend indicator is below the Arweave price (AR) and green in color, suggesting a bullish trend. This indicator typically provides signals for trend direction; as long as the price remains above this line, the uptrend is considered intact. The Arweave price has been in an uptrend as shown by the consistent higher highs and higher lows over the period displayed.
The ADX is currently at a value of 39.78, which indicates a strong trend. Generally, an ADX value above 25 suggests that the market is trending, and the higher the value above 25, the stronger the trend. The rising ADX in the context of a rising price suggests that the uptrend is strong. The Arweave price stood at $32.9 as of press time, representing a 28% pump in the last 24 hours.
Axelar Price Review
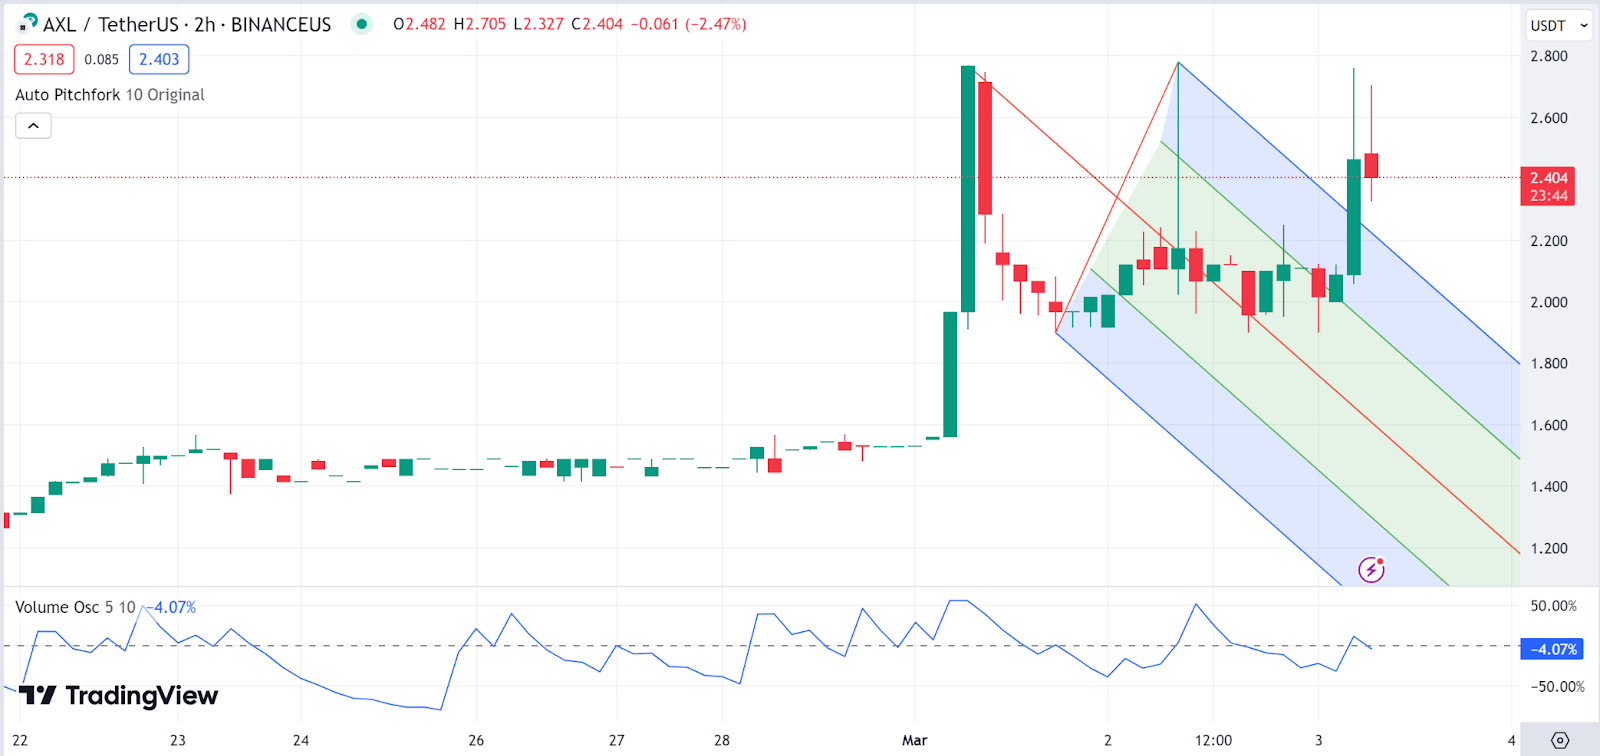
The Axelar (AXL) chart shows that the Axelar price is currently within the lower half of the pitchfork, suggesting that the price is in a downtrend or pulling back within an uptrend.
The Volume Oscillator is below the zero line and is showing -4.07%, indicating that the volume is currently lower than the average volume over the last 5 and 10 periods. This could be interpreted as decreasing interest or momentum in the current price movement. The Axelar price stood at $2.3 as of press time, representing a 21% pump in the last 24 hours.
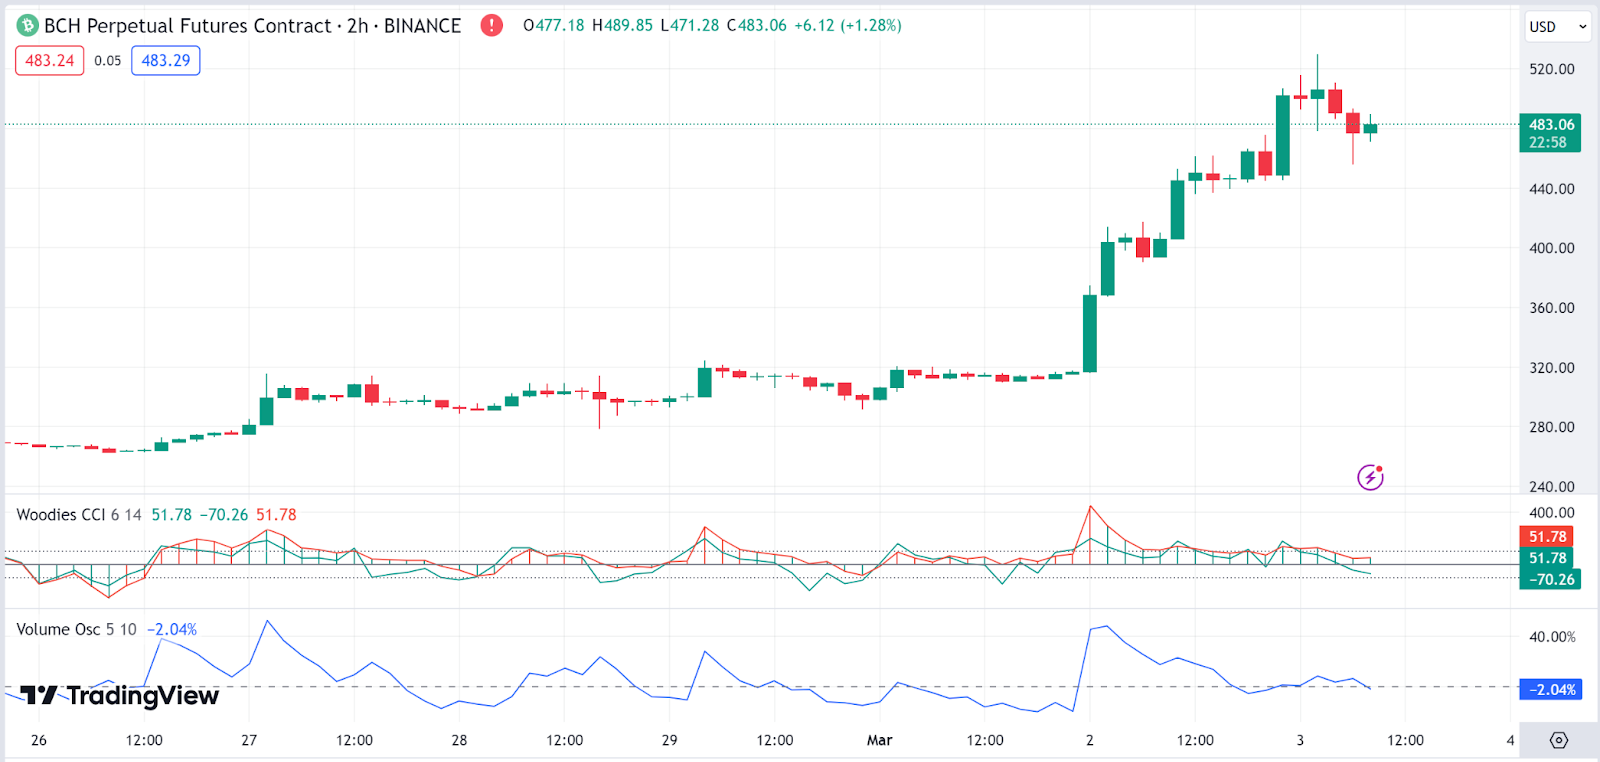
Bitcoin Cash Price Review
Looking at Bitcoin Cash (BCH), we notice that the CCI line (turquoise) is above the signal line (red), which typically suggests bullish momentum. However, both lines are starting to converge, which might indicate that the momentum is weakening.
The Woodies CCI lines are also above the zero line, which often confirms a bullish sentiment. However, traders would watch for these lines to cross below the zero line as a potential indicator of a change in trend.
The Volume Oscillator is below the zero line at -2.04%, which indicates that the current volume is less than the average volume over the last 5 and 10 periods. This could suggest a lack of conviction in the current Bitcoin Cash price movement and may precede a change in trend direction or a continuation of consolidation. The Bitcoin Cash price stood at $478.48 as of press time, representing an 18.1% pump in the last 24 hours.
Source: https://blockchainreporter.net/daily-price-review-btc-eth-ar-axl-bch/