
Markets have now entered a consolidation phase as shown by the minor retractment on the global market cap. The total cap stood at $2.48 as of press time representing a 1.33% decrease from its previous 24-hour one.
Bitcoin Price Review
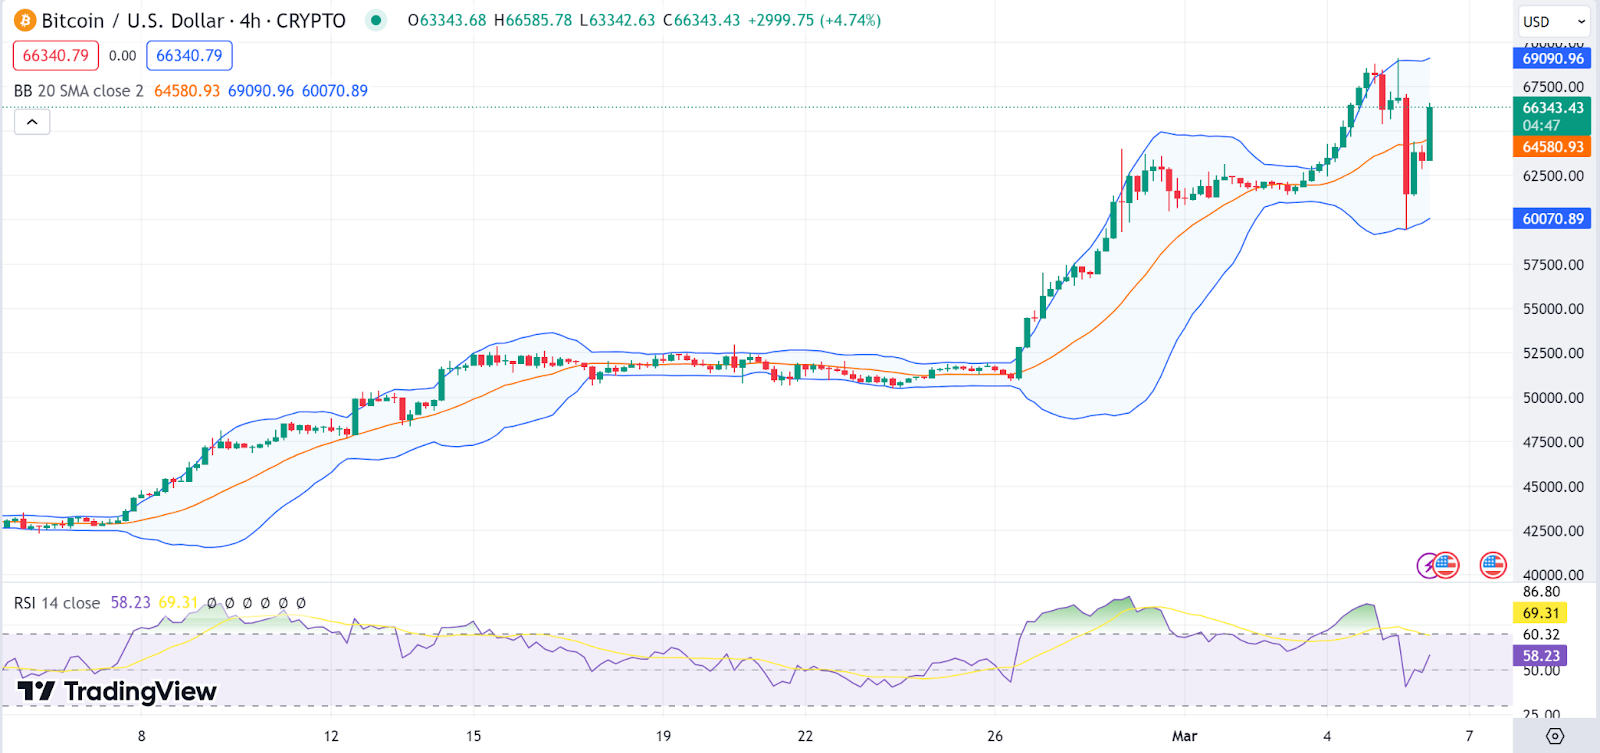
*BTC* has now gotten into a consolidation phase ahead of its recent pumps. Looking at the 4-hour BTC/USD charts, we notice the Bitcoin price is approaching near the upper band, suggesting strong upward momentum. The RSI value is around 58, as it heads north
The strong upward movement near the upper Bollinger Band suggests a potential continuation of the recent bullish trend. The Bitcoin price stood at $66.78K as of press time, representing a 0.87%% dump in the last 24 hours.
Ethereum Price Review
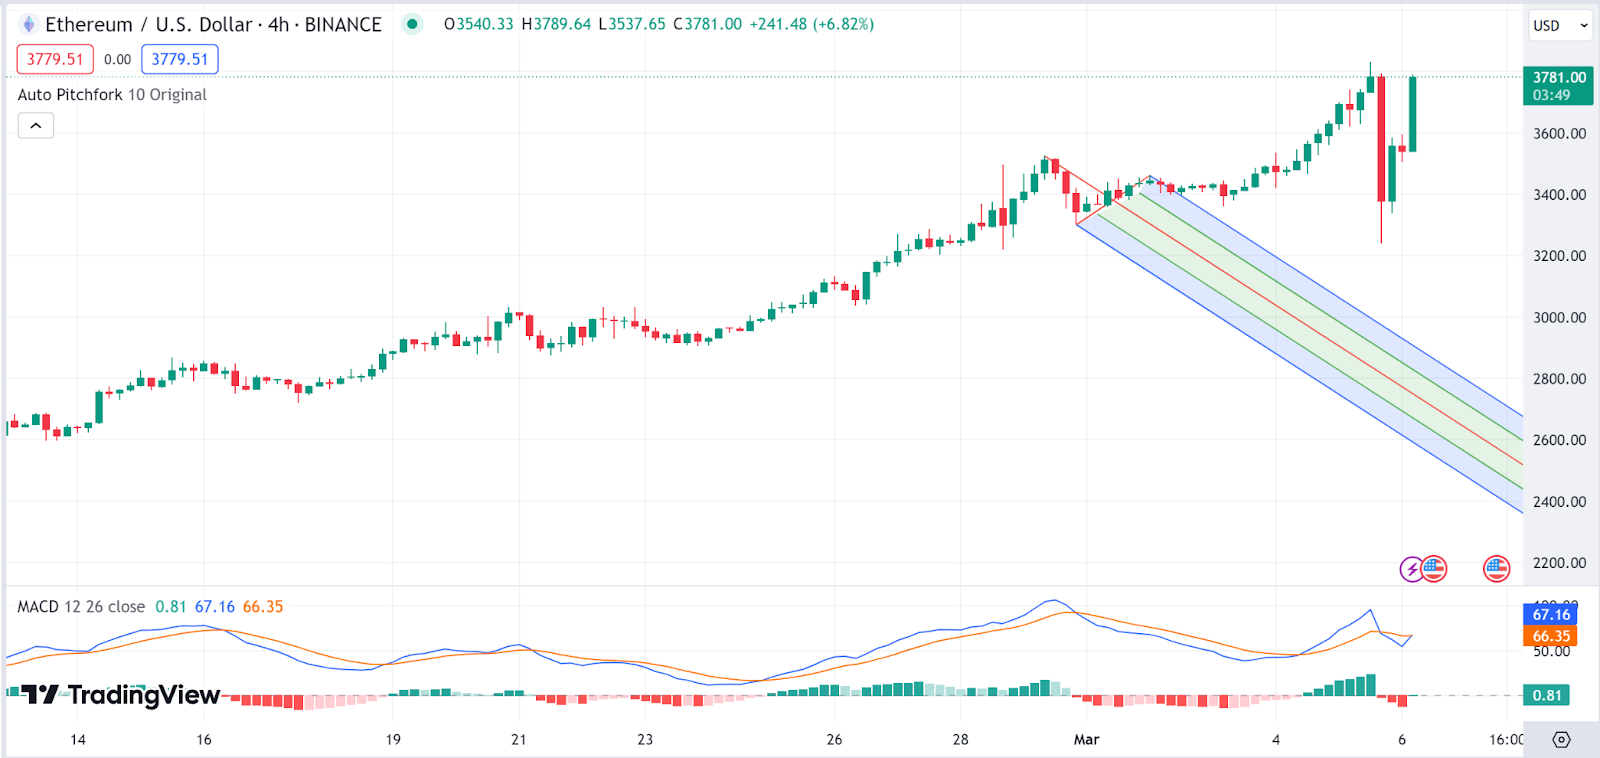
*ETH* continues to post pleasant results as the Ethereum price chart shows. The Ethereum price has exited the upper half of the pitchfork, suggesting that the Ethereum price is currently on a strong uptrend as the altcoin king also posted notable gains in today’s session.
The MACD indicator is, however, in the red zone suggesting a bear trend formation with a plunge in the short term likely. The Ethereum price stood at $3809 as of press time, representing a 3.85% pump in the last 24 hours.
Dogwifhat Price Review
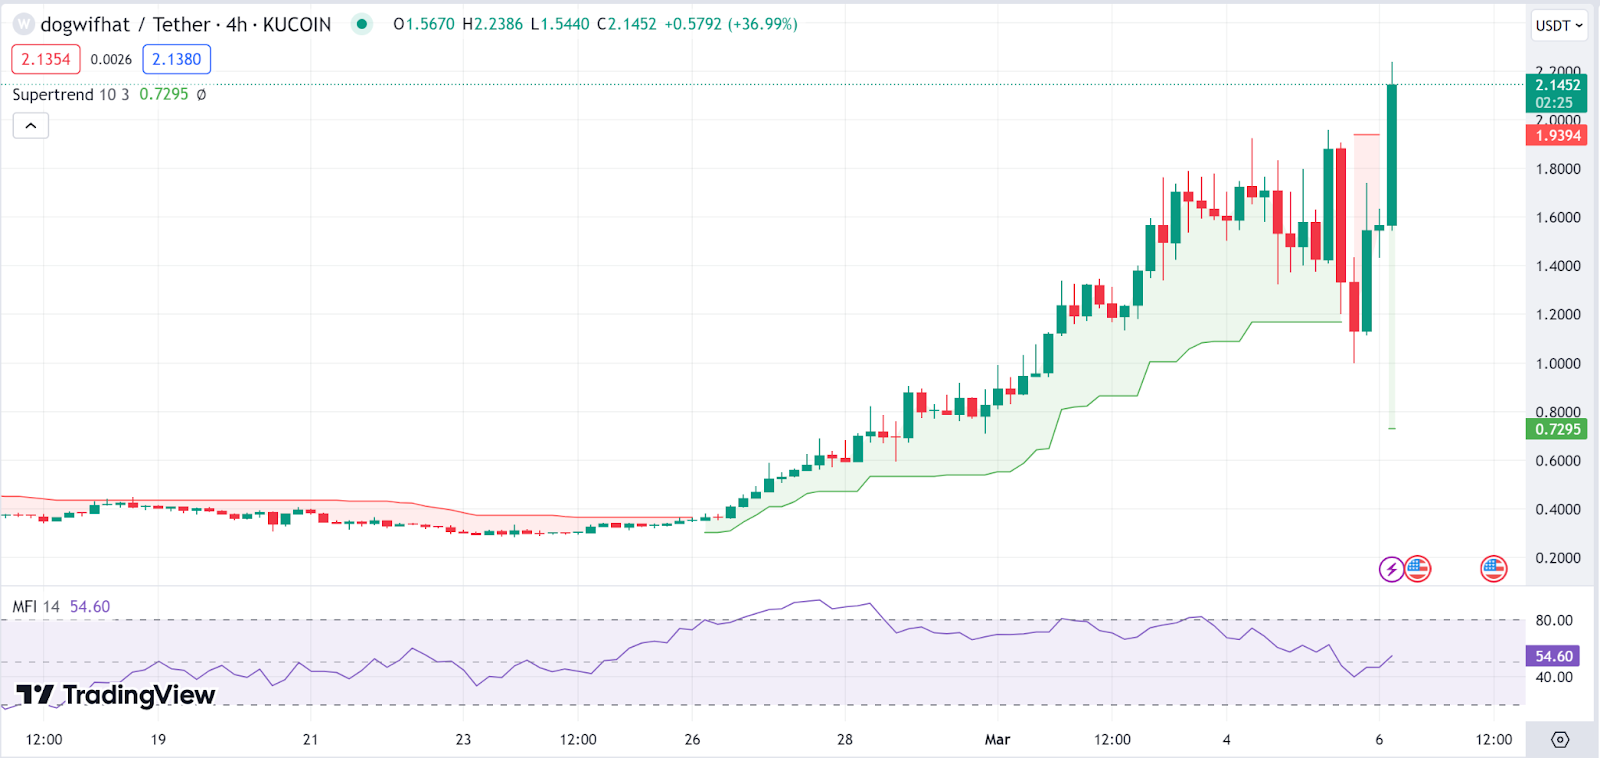
Dogwifhat (WIF) has emerged as today’s top gainer. The Supertrend indicator was initially below the Dogwifhat price (AR) and green in color, before shifting above the price movement, suggesting fading bullish momentum. Should the Dogwifhat price remain below this line, looming corrections will be evident.
The Money Flow Index (MFI), which is at 54.6, is headed south. This indicates some buying pressure. The Dogwifhat price stood at $2.12 as of press time, representing a 48.5% pump in the last 24 hours.
Aptos Price Review
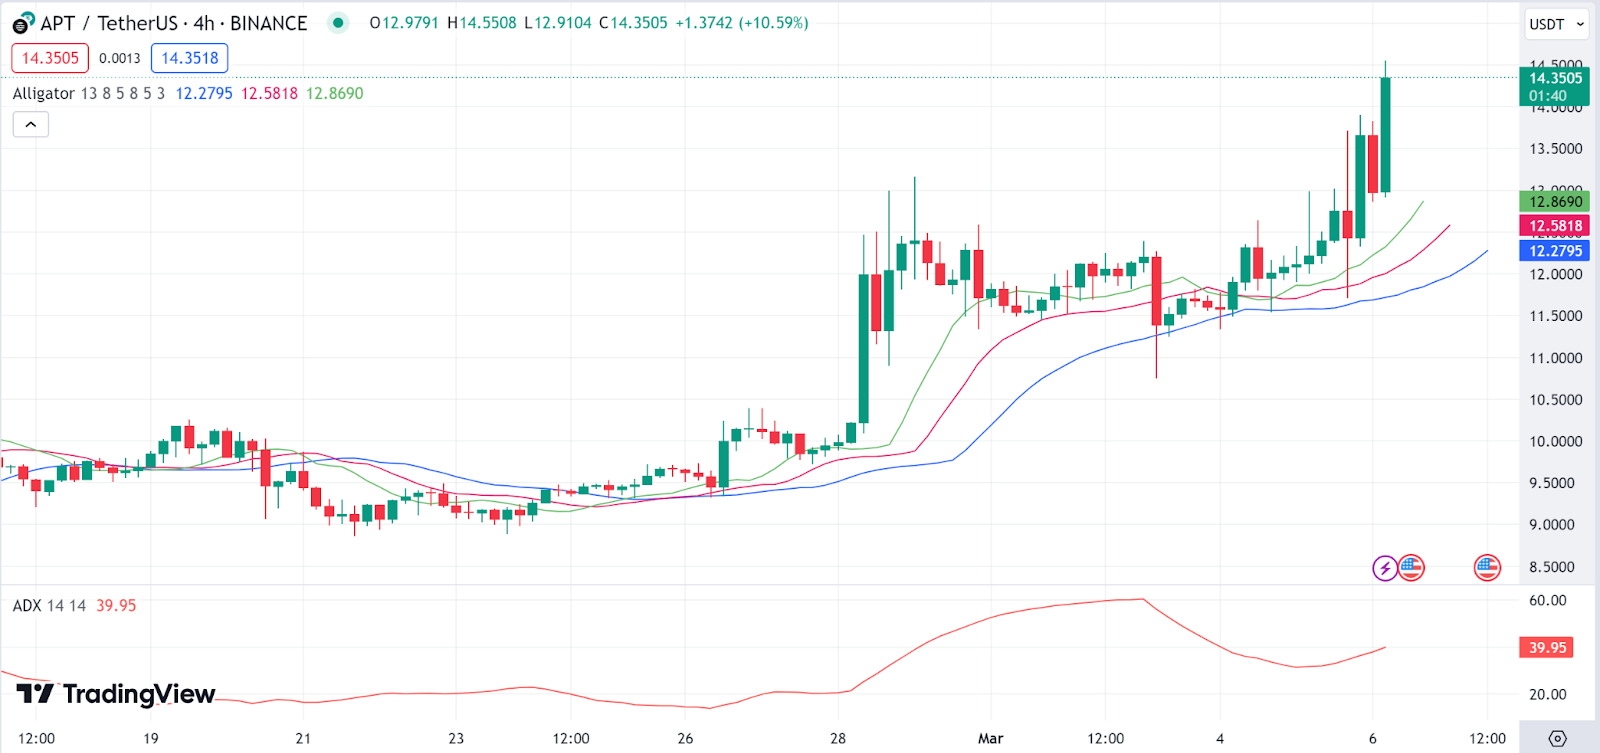
Aptos (APT) is also another gainer today as it posted notable gains. The Aptos price has been following an upward trend as indicated by the Alligator indicator, which is a collection of moving averages that suggest a bullish trend when the green line (lips) is above the red line (teeth) and the blue line (jaw).
The ADX is currently at a value of 39, which indicates a strong trend. Generally, an ADX value above 25 suggests that the market is trending, and the higher the value above 25, the stronger the trend. The Aptos price stood at $14.22 as of press time, representing a 15.7% pump in the last 24 hours.
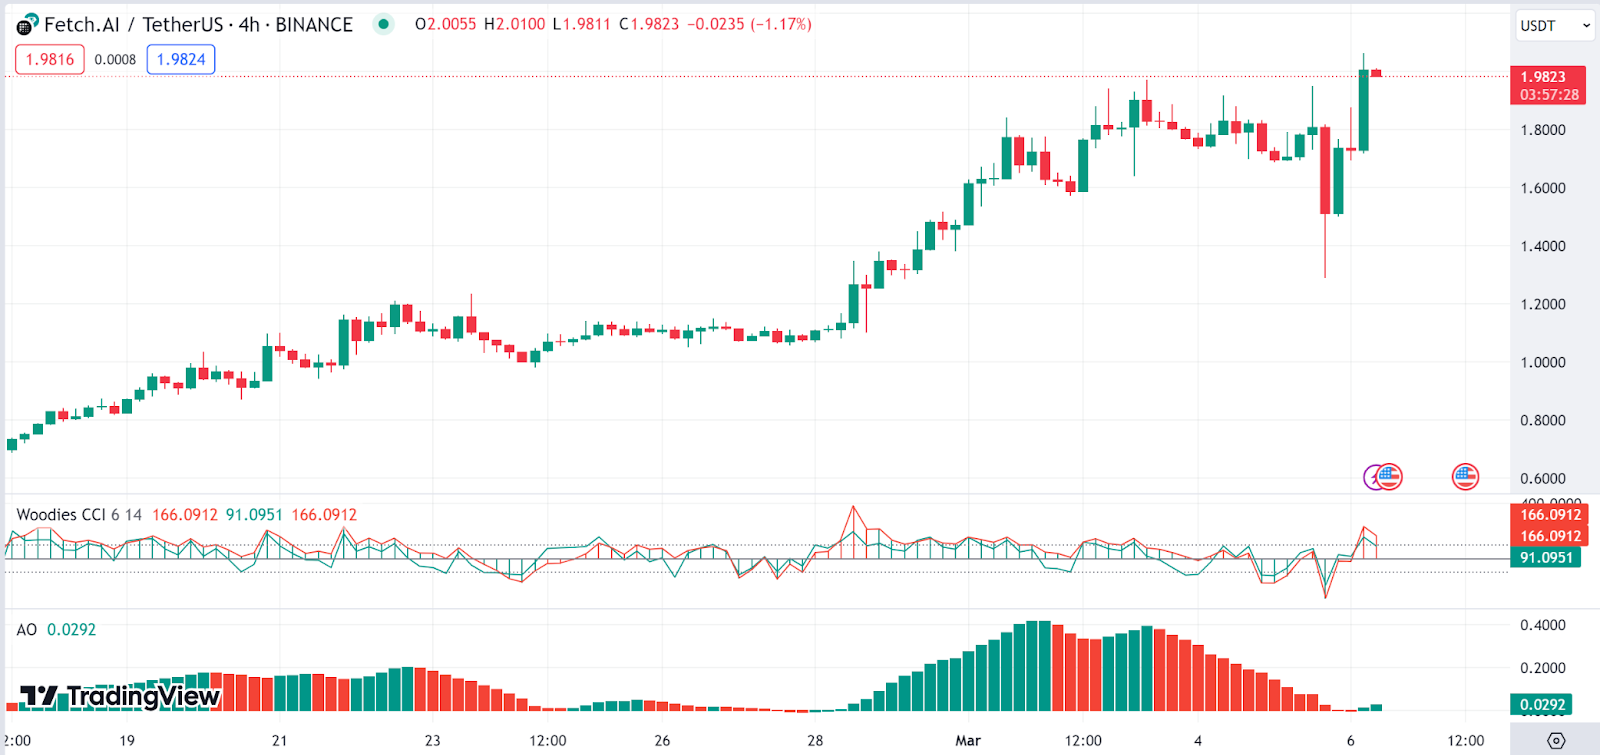
Fetch.ai Price Review
Fetch.ai (FET) is today’s third top gainer. Looking at Fetch.ai price charts, we notice that the CCI line (turquoise) is above the signal line (red), which typically suggests bullish momentum. However, both lines are converging towards the zero line showing failing bull momentum.
Despite this, the Awesome Oscillator, used in gauging trends, has shifted back to green histograms as it now moves further above the zero line indicating a strong bullish trend. The Fetch.ai price stood at $2 as of press time, representing a 17% pump in the last 24 hours.
Source: https://blockchainreporter.net/daily-market-review-btc-eth-wif-apt-fet/