
Bulls continue to show dominance as the markets start another day on an uptrend. The total global market cap stood at $2.72 trillion as of press time representing an increase of 13.6% over the last 24 hours.
Bitcoin Price Review
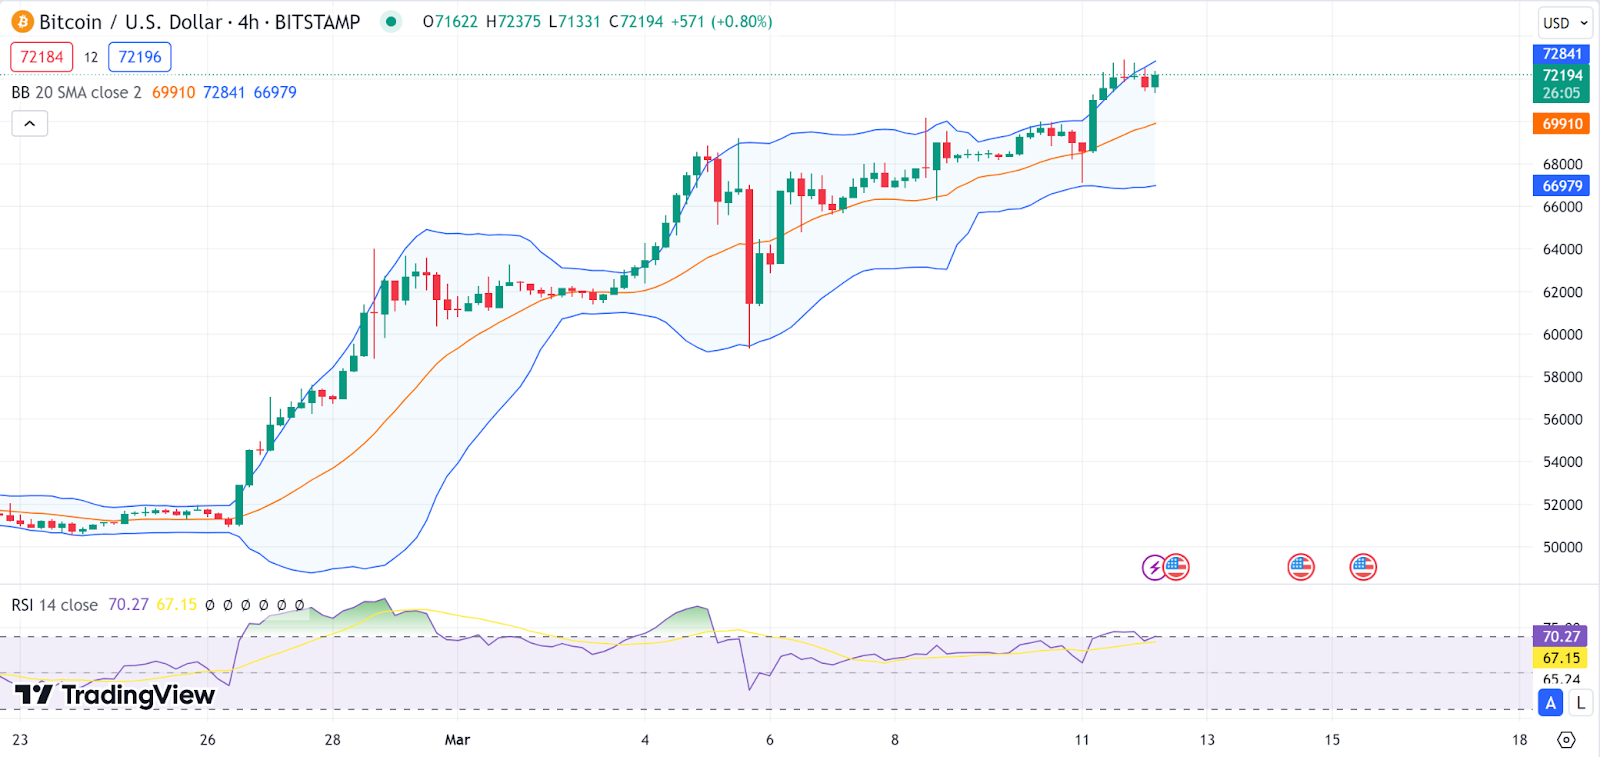
Bitcoin (BTC) is still showing strength as consolidates around $72K. Looking at 4-hour BTC/USD charts, we notice the Bitcoin price is moving close to the upper band, suggesting strong upward momentum. The RSI value is around 70, suggesting an overbought Bitcoin market.
However, the RSI’s overbought conditions might caution on looming corrections on the crypto king. The *BTC* stood at $72.1K as of press time, representing a 2% pump in the last 24 hours as the crypto king surges again.
Ethereum Price Review
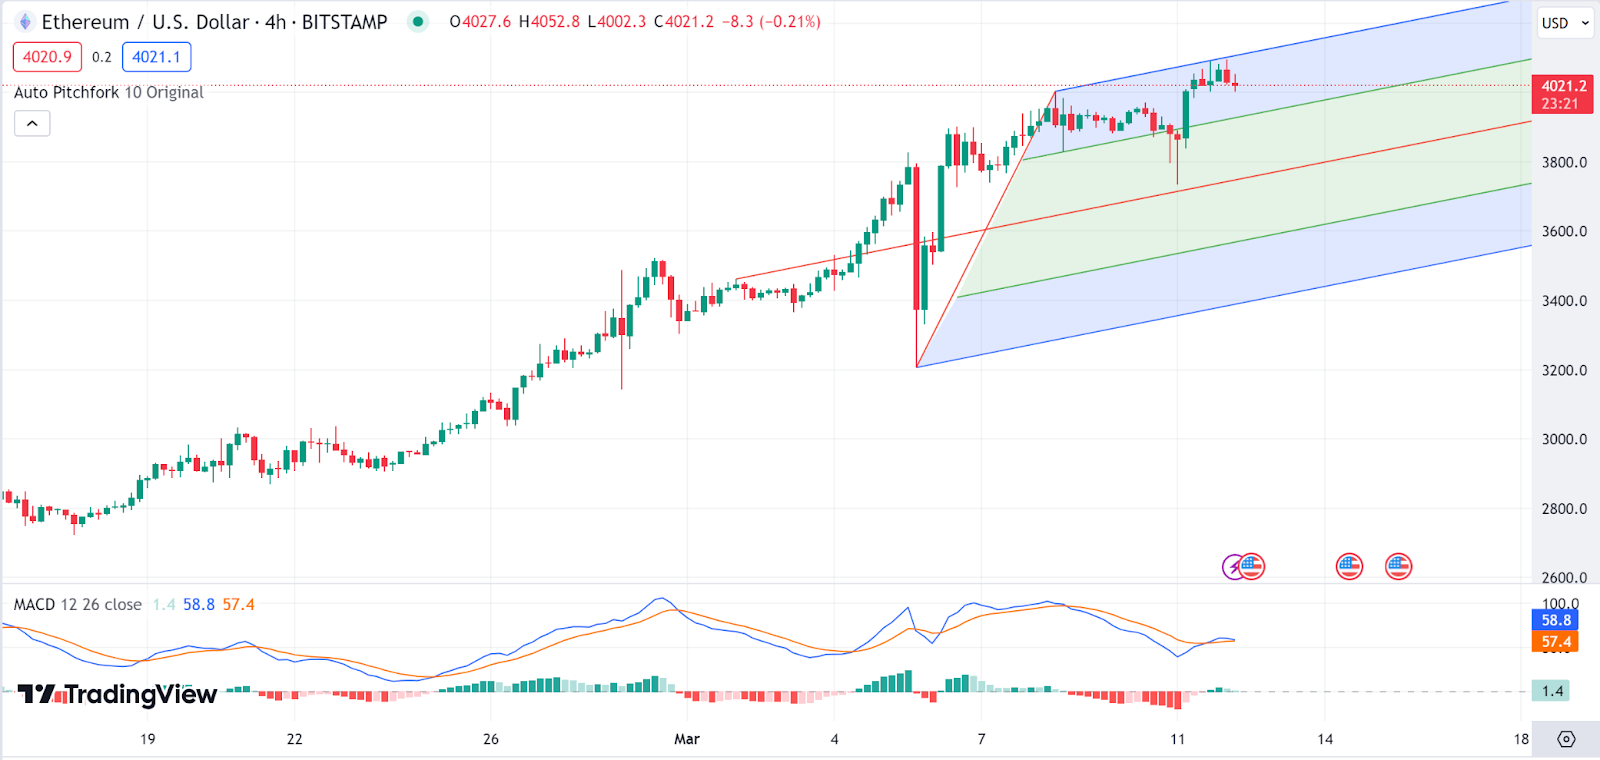
The Ethereum (ETH) chart shows that the Ethereum price is within the upper half of the pitchfork but shows a mixture of bearish and bullish candle sticks, suggesting that the current bull trend on Ethereum is a bit shaky.
The MACD, currently in the green zone, is reverting toward the red zone suggesting a change in momentum from bullish to bearish. The *ETH* stood at $4019 as of press time, representing a 0.59 pump in the last 24 hours.
Toncoin Price Review
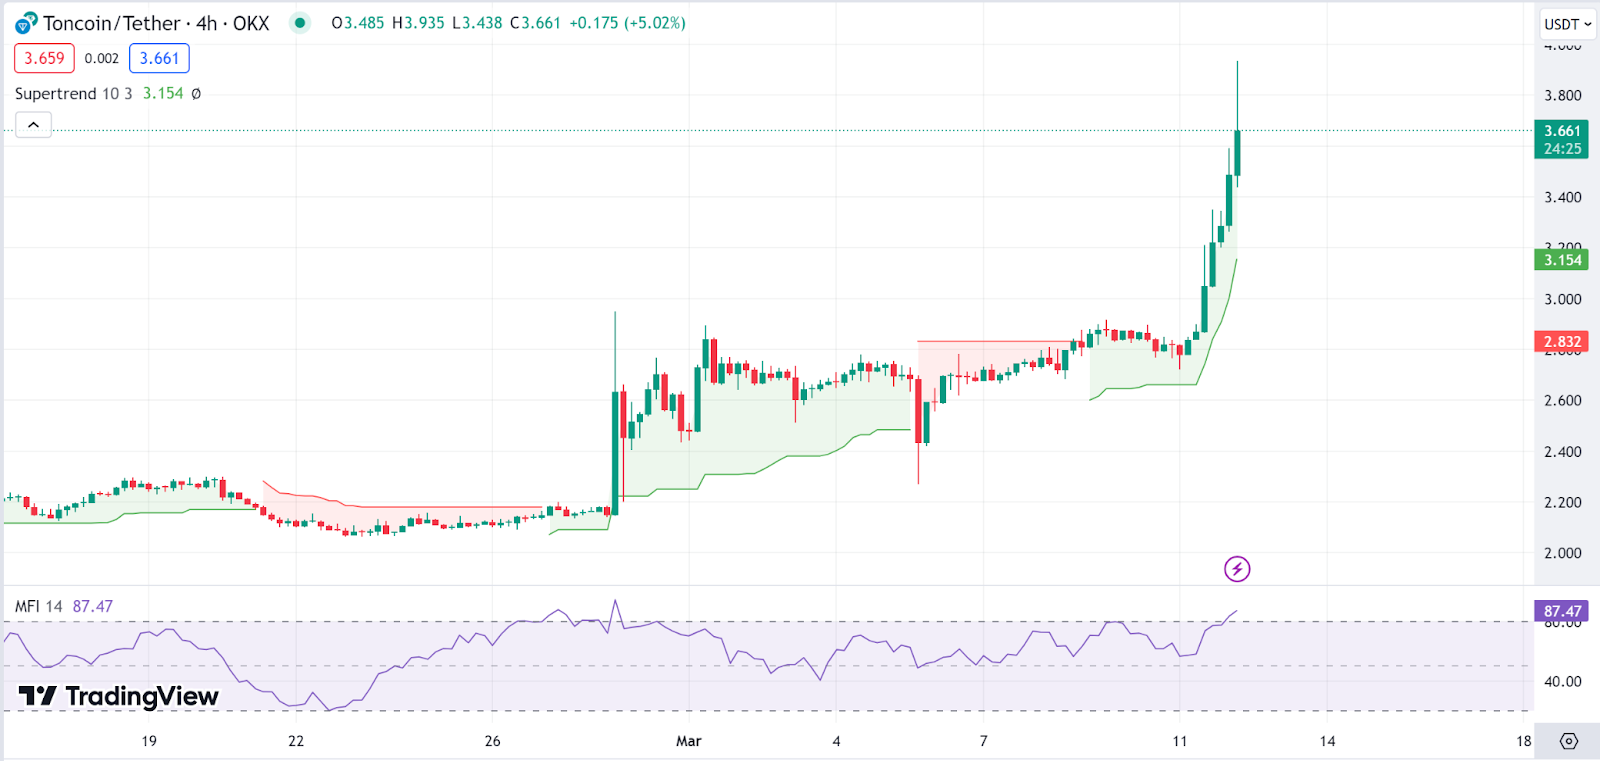
Toncoin (TON) is today’s top gainer with the Supertrend indicator below the Toncoin price (GALA) and green in color, suggesting a bullish market for TON. The Gala price has been in an uptrend as shown by the latest series of green candle sticks alongside consistent higher highs and higher lows over the period displayed.
The Money Flow Index (MFI), which is at 87, is in the overbought zone. This indicates massive buying pressure, supporting today’s pump. However, overbought conditions could also imply looming corrections. The Toncoin price stood at $3.65 as of press time, representing a 27.6% pump in the last 24 hours.
IOTA Price Review
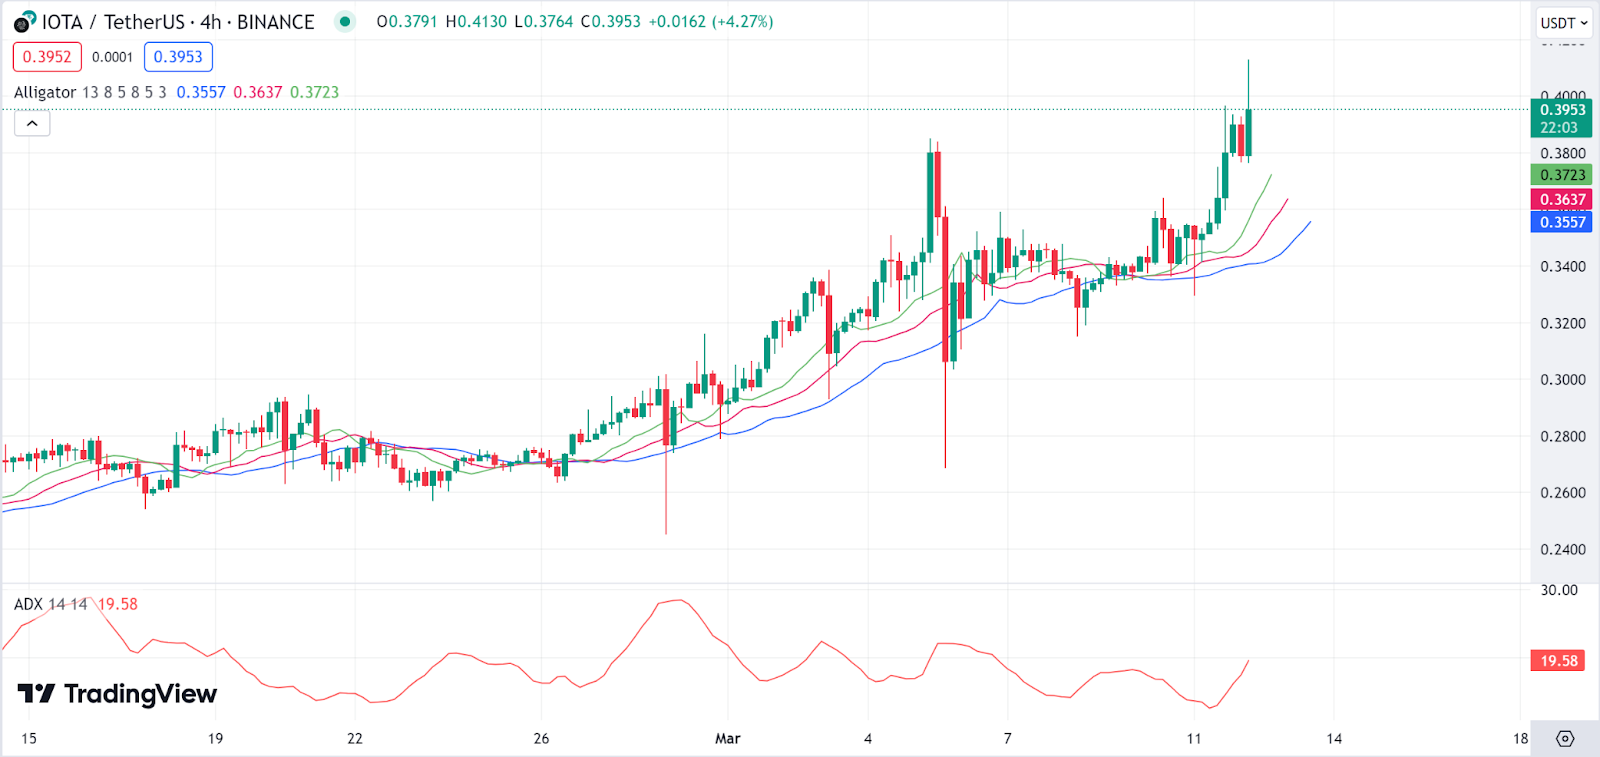
The IOTA price is in an upward trend as the token emerges as today’s second top gainer. The Alligator indicator, which is a collection of moving averages, suggests a bullish trend with the green line (lips) above the red line (teeth) and the blue line (jaw).
The ADX is currently at a value of 19, which indicates a rather moderate trend. However, the rising ADX in the context of a rising price suggests that the uptrend is getting stronger. The IOTA price stood at $0.392 as of press time, representing a 11.6% pump in the last 24 hours.
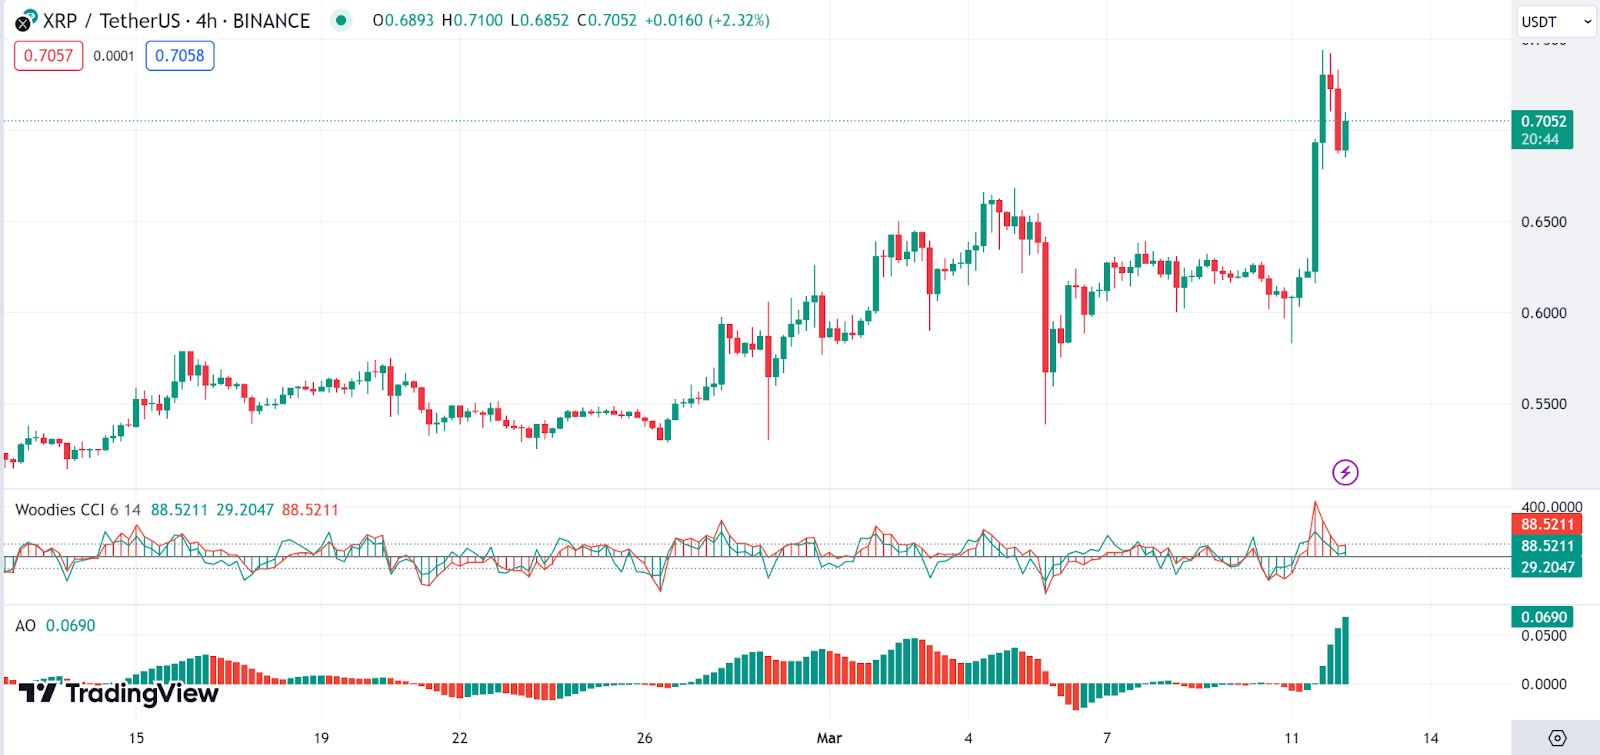
Ripple Price Review
Ripple (XRP) is today’s third top gainer. We notice that the CCI line (turquoise) is above the signal line (red), which typically suggests bullish momentum. Both lines are diverging, which might indicate that the momentum on Ripple is getting stronger.
The Awesome Oscillator, used in gauging trends, is showing green histograms as they increase in size indicating a strong bullish trend. The *XRP* stood at $0.7063 as of press time, representing a 13.8% pump in the last 24 hours.
Source: https://blockchainreporter.net/daily-market-review-btc-eth-ton-iota-xrp/