The Bitcoin price sustainability at $25550 is influencing reversal opportunities in major altcoins
Published 10 hours ago
Despite the recent market volatility, Bitcoin(BTC) has found reliable support at $25500. Over the past three weeks, even amidst the crypto market’s unpredictability, this coin price has bounced back from the bottom creating a sense of reversal to major altcoins.
As of 5:51 a.m. on Saturday, the global cryptocurrency market capitalization is at $1.04 trillion, projecting a 0.63% drop since yesterday. Moreover, the market has seen a drop in trading volume to 34.28% Billion registering a 9.89% loss in the last 24 hours.
Also Read: Bitcoin (BTC) Price Stalls as US Dollar Hits 8th Weekly Gain, Calls for Concern?
Bitcoin Price Analysis: Double Bottom Pattern Sets $BTC Rally to $31000
 Source- Tradingview
During the latest market downturn, Bitcoin price recovery hit a roadblock at $28176, leading to a 9.5% decline that revisited the local support of $25500. Although the recovery effort wasn’t successful, the persistent defense of the aforementioned level mark and the lower trendline underscores their importance in influencing the near future trend.
Multiple lower-price rejection candles at $25000 indicate the buyers’ active accumulation at a discounted price. If the bullish momentum persists, a potential swing will shape a bullish reversal pattern called a double bottom.
In response to this setup, the BTC price can rally back to $31000.
Synthetix Price Analysis: Trendline Breakout Triggers a Directional Rally
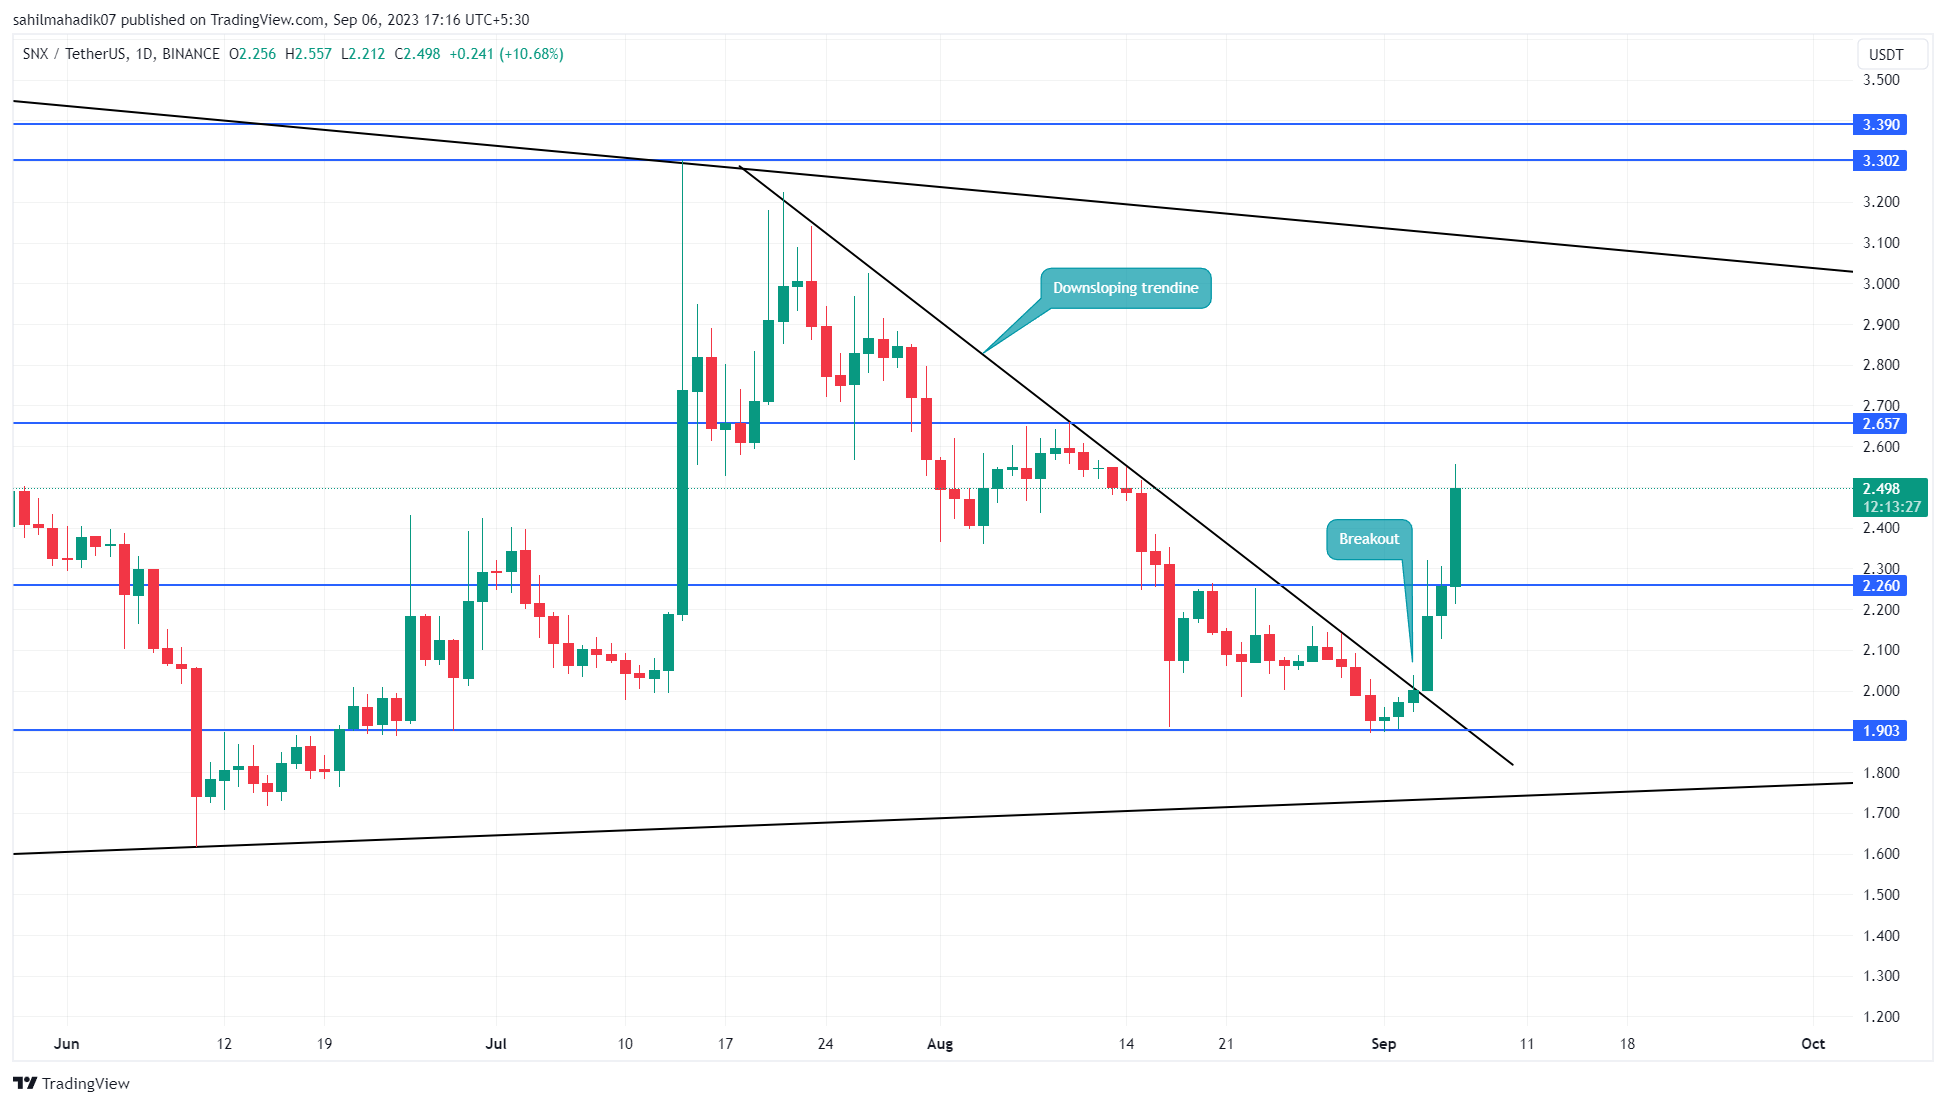 Source- Tradingview
On September 4th, the Synthetix price gave a massive breakout from the downsloping trendline. Breaking above the barrier carried a correction of nearly six weeks signaling the potential for a significant upswing.
The SNX price rose for six consecutive days, registering a 31.3% gain to reach $2.499. The coin price may see a major pullback to recuperate bullish momentum, while the potential rally may reach $2.65, followed by $3.3
Solana Price Analysis: Wedge Pattern Hints Potential Trend Change
Source- Tradingview
In the daily chart, the Solana price displays the formation of a falling wedge pattern, characterized by a steady narrowing between two converging trend lines. As long as this fall persists, there’s a potential for the price to further decline toward the significant $17 threshold.
However, in theory, this ending diagonal pattern hints at the weakening bearish momentum and the possibility of a trend reversal. a bullish breakout above the upper trendline will potentially propel the price back toward the $30 range.
Share this article on:
The presented content may include the personal opinion of the author and is subject to market condition. Do your market research before investing in cryptocurrencies. The author or the publication does not hold any responsibility for your personal financial loss.
Source: https://coingape.com/markets/cryptocurrency-prices-today-bitcoin-solana-synthetix-analysis/