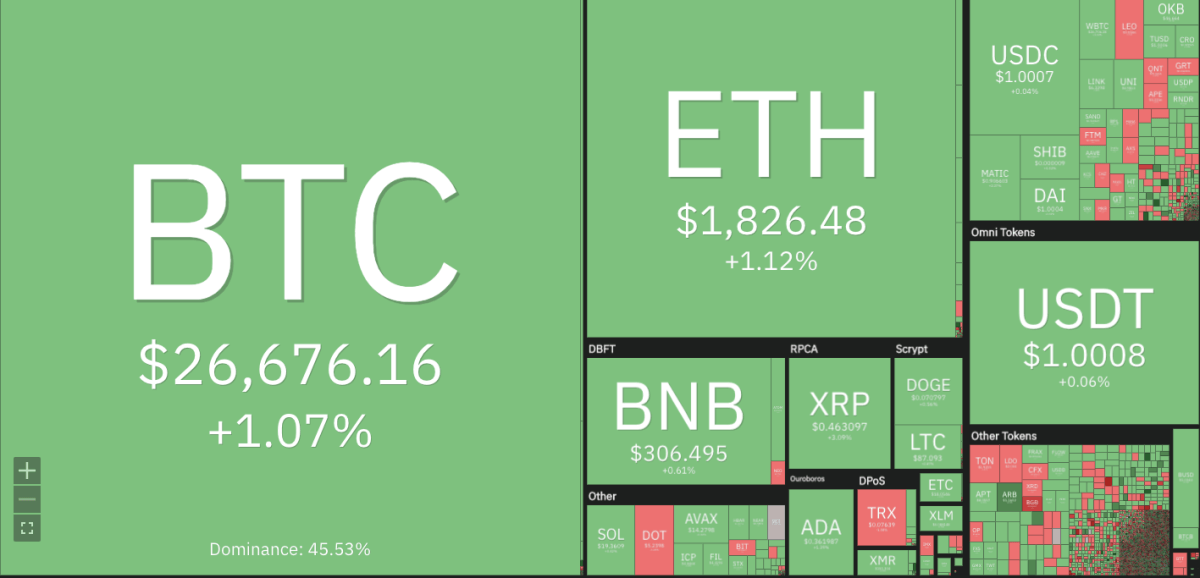
The Bitcoin price analysis shows a bullish trend, as an increase has been recorded in the last 24 hours. The market has been following bullish for the past few hours, and the price has significantly increased. The BTC/USD pair has surged to $26,676 in the last 24 hours as more investors are showing interest in the token.

Bears have been fighting hard against the bulls, but they have not been able to bring the price down. The bullish trend has been quite steady, and the buying pressure is increasing steadily. If this trend continues, it is expected that BTC could surge toward the $27k level soon. The market sentiment for Bitcoin remains positive, with more investors joining in as the bullish trend persists.
Bitcoin price analysis 1-day price chart: Buying pressure mounts as bulls take control
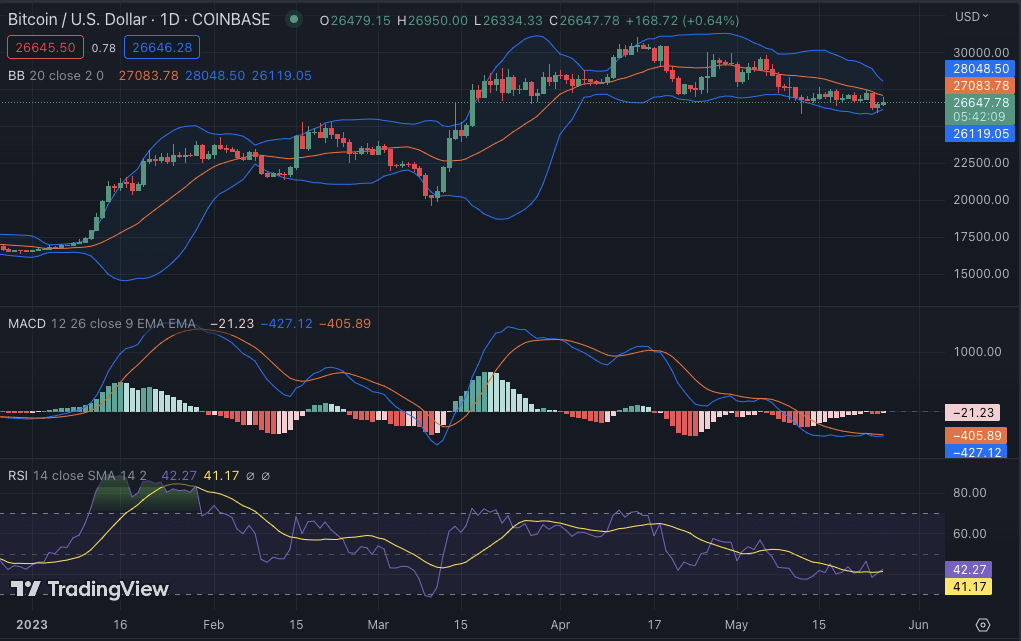
The one-day Bitcoin price analysis is dictating a rise in price as the green candlestick has returned to the price chart. The Bulls have been able to make a successful comeback after going through a loss in the past few days. The price has improved by 1.07% from yesterday’s $26,333 low and is now trading at the $26,790 level. The current market situation is very positive for the bulls, and the price is expected to stay above $27,000 in the coming days.

Technical indicators on the daily, hourly, and 24-hour charts all indicate positive momentum, suggesting that the bulls are in charge of the market. The Bollinger Bands are widening, suggesting that the volatility could be increasing in the market. The lower band is at $26,119, and the upper band is at $28,048. The Relative Strength Index (RSI) is also rising, indicating that the buying pressure is continuing in the market. The MACD is also heading toward the bullish region, which could signal further price increases. The moving average indicator is currently at $26,819 and is pointing toward the bullish region.
Bitcoin price analysis 4-hour chart: Bull takes the lead
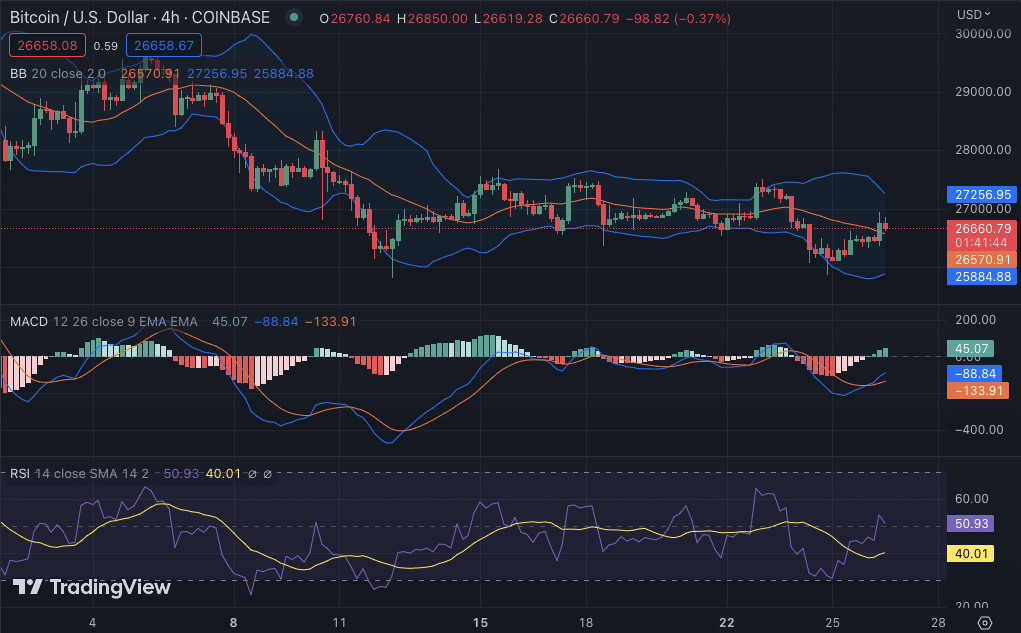
The 4-hour Bitcoin price analysis shows a rise in price as the Bulls have been able to take control of the market. If selling pressure does not increase, the BTC token could hold on to its gains and continue to surge higher. The 20 EMA has crossed above the 50 EMA, indicating a bullish crossover. The price is currently trading above both EMAs, suggesting that the bulls are in control. The Bollinger bands on the 4-hour chart indicate increasing volatility. The upper band is at $27,256 and the lower band is at $25,884, indicating that the price could stay in this range.

According to BTC price analysis, green candlesticks have formed, pointing to an upswing for the token. Investors are drawn to buy Bitcoin because the MACD blue line is currently in the positive area and has passed the signal line. The MACD histogram is also in the positive area, indicating an upward tendency. As of this writing, the Relative Strength Index (RSI) is at 50.93, which shows that the market is healthy because it is not in the overbought or oversold zone. The bullish trend may continue as a result of this. The 50-day and 200-day moving averages are currently at $25,441 and $22,566, respectively.
Bitcoin price analysis conclusion
In conclusion, the Bitcoin price analysis shows that the bulls are in control and the market is looking positive. The bullish momentum has been building steadily for the past few hours, and if it persists, BTC could target the $27k level soon. Bulls have been able to counter the bearish waves, and the price is expected to remain above $26,000 for the time being. Technical indicators have all turned positive, suggesting that further gains could be on the horizon.
While waiting for Bitcoin to move further, see our Price Predictions on XDC, Cardano, and Curve
Source: https://www.cryptopolitan.com/bitcoin-price-analysis-2023-05-26/
