Bulls continue to show resilience in markets as shown by the rise in global market cap over the last day. The total global market cap stood at $2.4 trillion as of press time representing an increase of 2.1% over the last 24 hours.
Bitcoin Price Review
Looking at the 4-hour BTC/USD charts, we notice the
is trading near the upper band, suggesting strong upward momentum. The RSI value is around 75-80, indicating that BTC might be overbought.
An RSI above 70 typically signals overbought conditions. Overall, the trend appears bullish, with higher highs and higher lows. The strong upward movement near the upper Bollinger Band suggests a potential continuation of the bullish trend. The Bitcoin price stood at $64.6K as of press time, representing a 5.2% dump in the last 24 hours as the crypto king surges again.

Ethereum Price Review
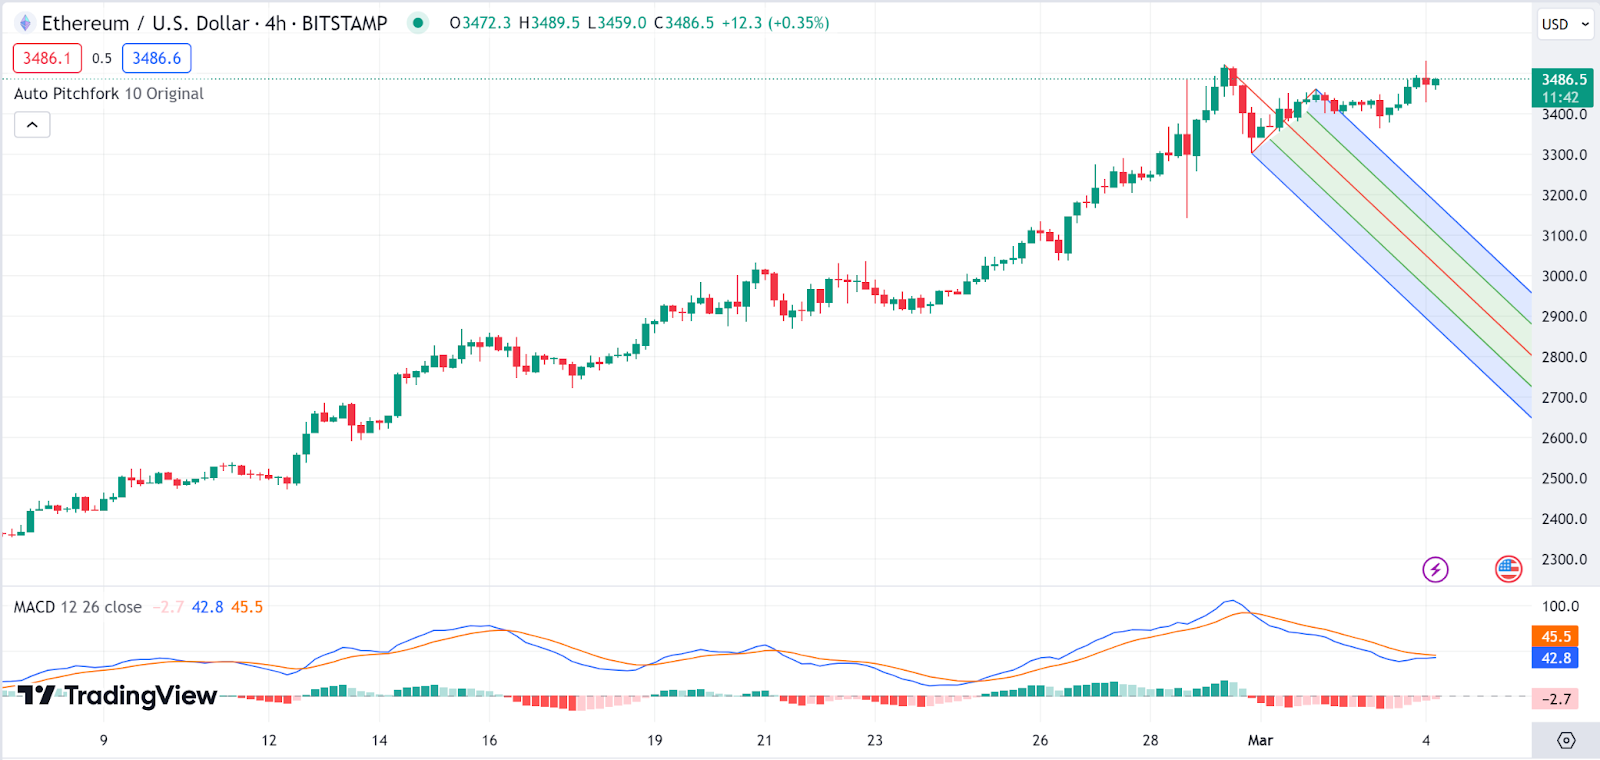
The
chart shows that the Ethereum price has exited the upper half of the pitchfork, suggesting that the Ethereum price is currently on a strong uptrend as the altcoin king also posted notable gains in today’s session.
The MACD indicator is now headed toward the zero line as it approaches a cross-over to the green zone indicating shifting momentum from bearish to bullish. The Ethereum price stood at $3510 as of press time, representing a 3.7% pump in the last 24 hours.
Pepe Price Review
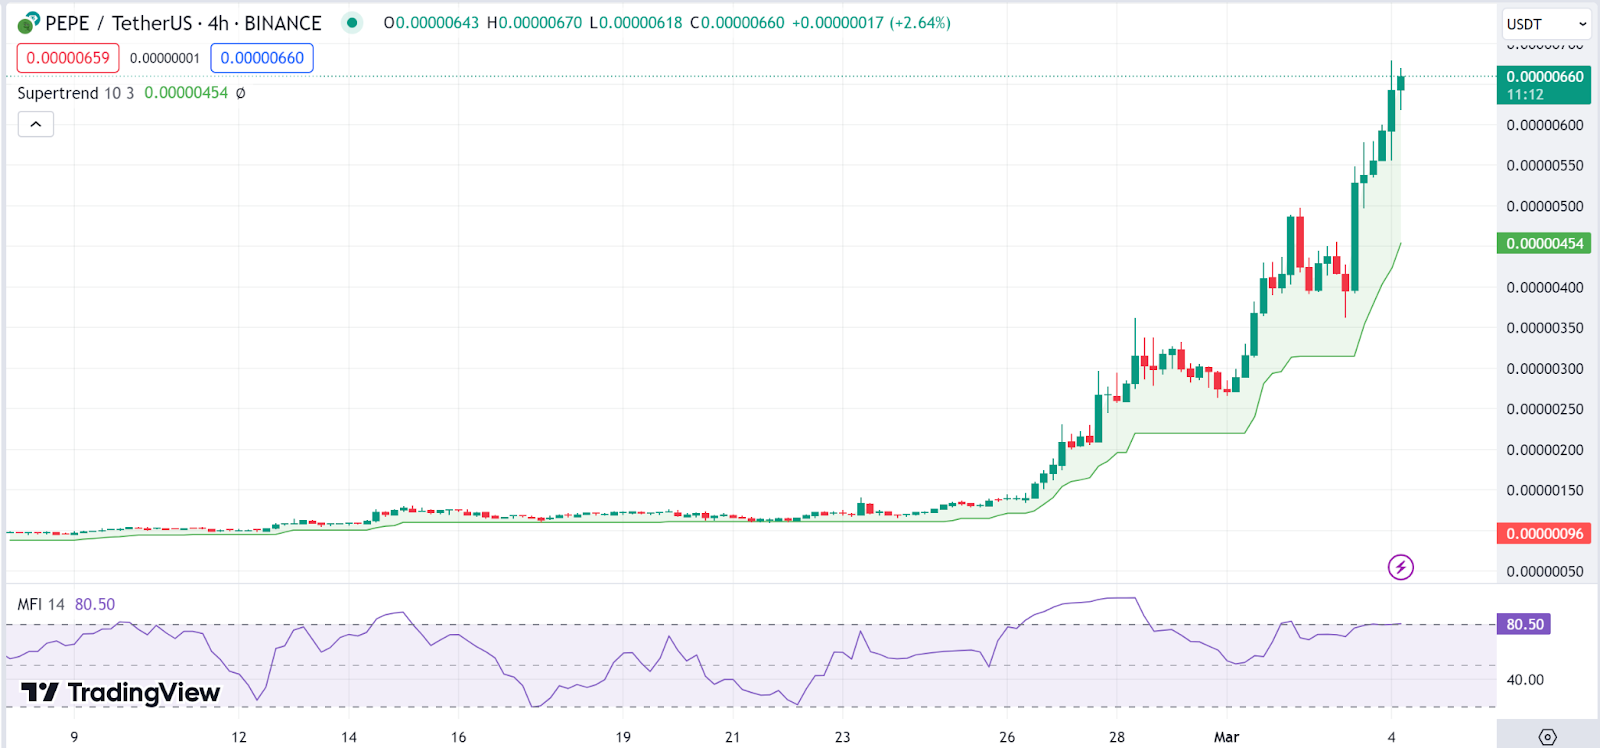
The Supertrend indicator is below the Pepe price (AR) and green in color, suggesting a bullish trend. As long as the Pepe price remains above this line, the uptrend is considered intact. The Pepe price has been in an uptrend as shown by the consistent higher highs and higher lows over the period displayed.
The Money Flow Index (MFI), which is at 80.5, is near the overbought zone. This indicates massive buying pressure, supporting today’s pump. A reading close to 80 often indicates overbought conditions in the market hence the risks of a correction. The Pepe price stood at $0.000006727 as of press time, representing a 69.4% pump in the last 24 hours.
FLOKI Price Review
The FLOKI price has been following an upward trend as indicated by the Alligator indicator, which is a collection of moving averages that suggest a bullish trend when the green line (lips) is above the red line (teeth) and the blue line (jaw).
The ADX is currently at a value of 62, which indicates a strong trend. Generally, an ADX value above 25 suggests that the market is trending, and the higher the value above 25, the stronger the trend. However, the dropping ADX in the context of a rising price suggests that the uptrend is strong. The FLOKI price stood at $0.0001556 as of press time, representing a 28.2% pump in the last 24 hours.

Shiba Inu Price Review
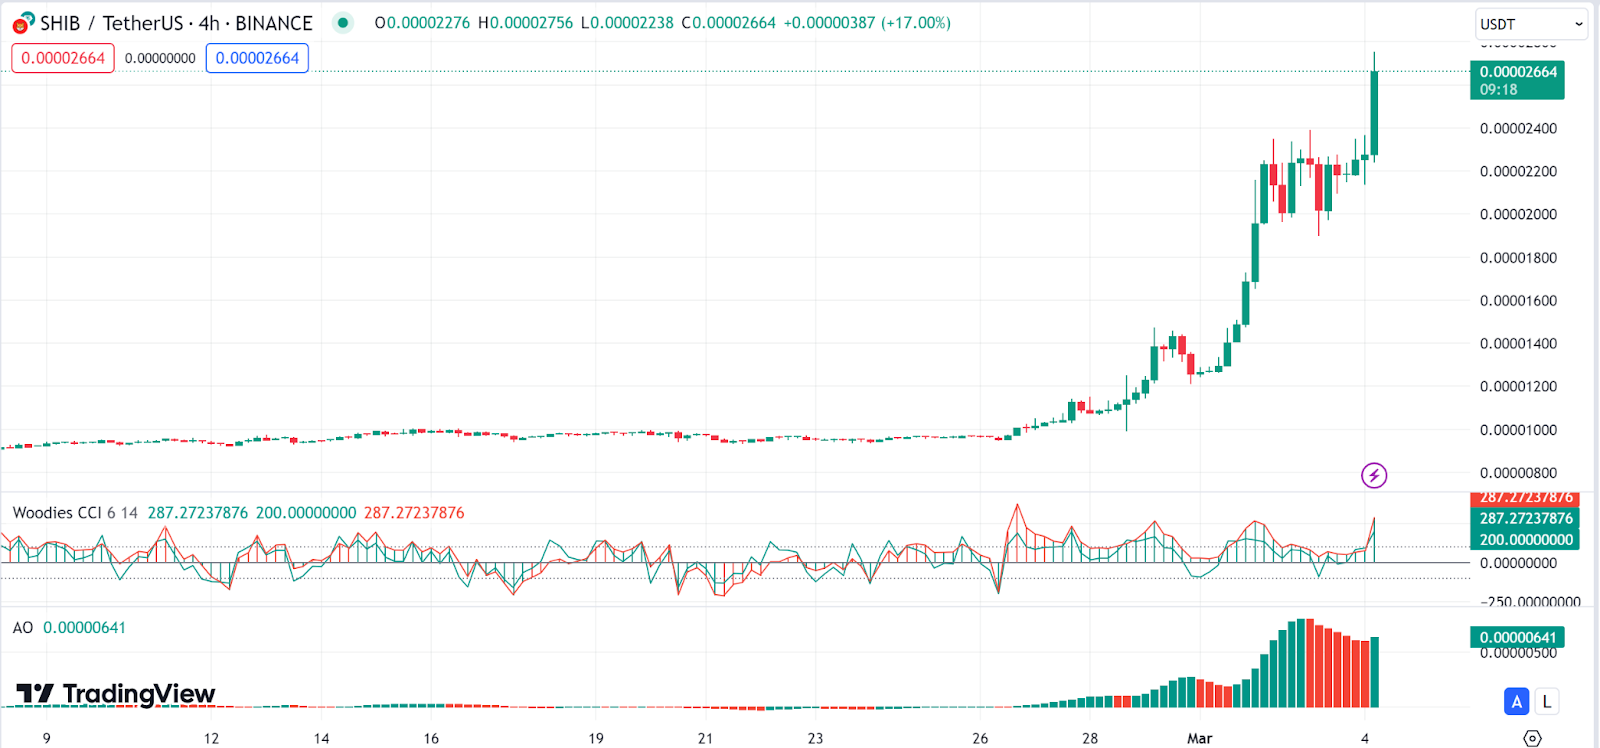
Looking at
, we notice that the CCI line (turquoise) is above the signal line (red), which typically suggests bullish momentum. Both lines are diverging, which might indicate that the momentum is getting stronger.
The Awesome Oscillator, used in gauging trends, has shifted back to green histograms as it now moves further above the zero line indicating a strong bullish trend. The Shiba Inu price stood at $0.00002676 as of press time, representing a 31.2% pump in the last 24 hours.
Source: https://blockchainreporter.net/daily-market-review-btc-eth-pepe-floki-shib/