Bulls remain dormant in today’s session as seen from the global market cap which has seen a 4.6% increase in the last 24 hours to leave the total global market cap at $2.66T as of press time while the trading volume also jumped by 46% to $111B.
Bitcoin Price Review
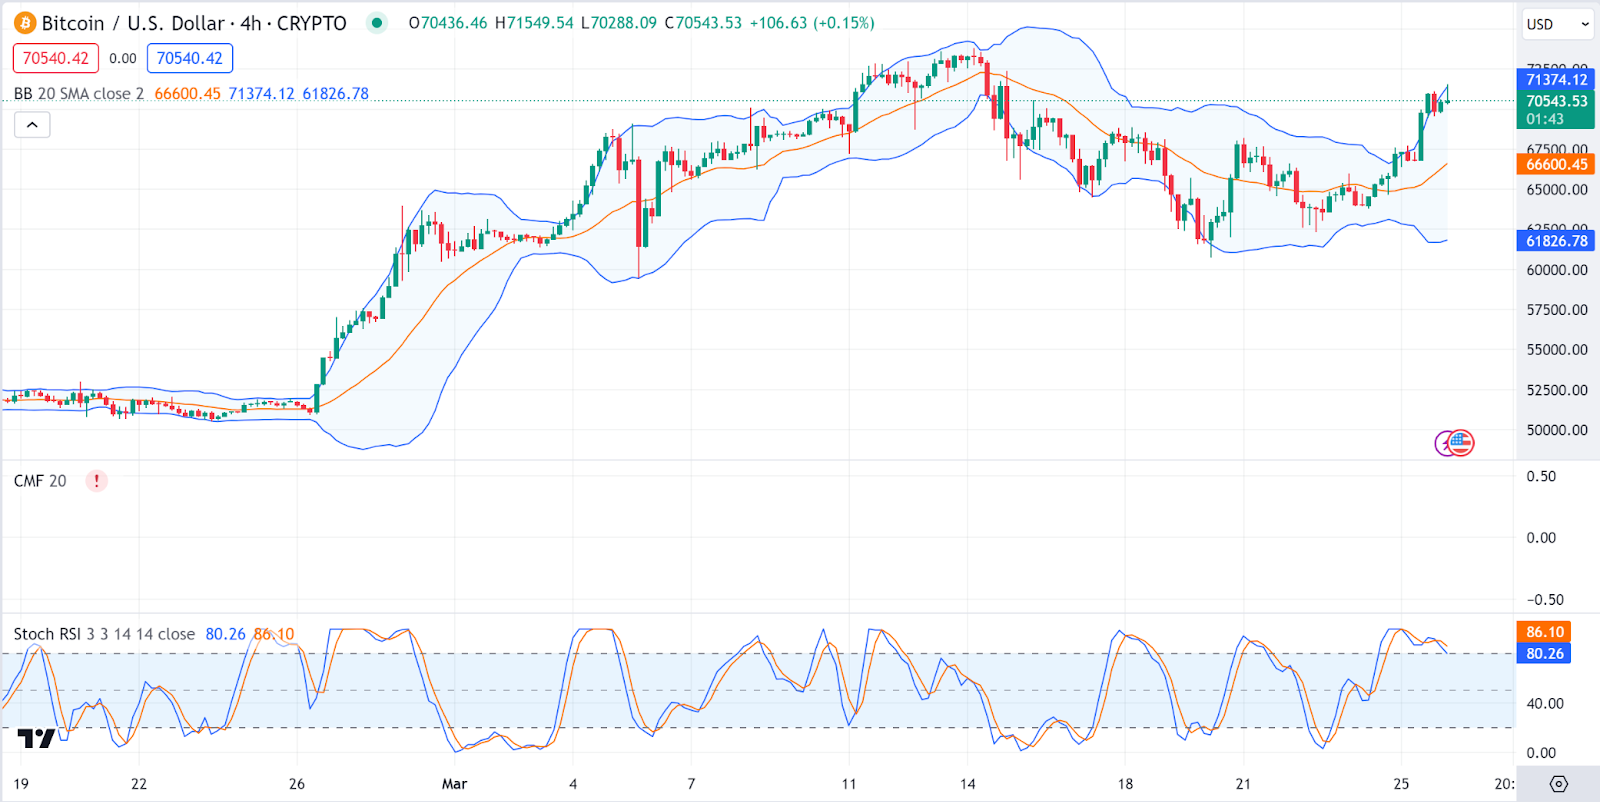
Bitcoin has started on massive bull activity as the crypto king crosses above $70K once again. The Bitcoin price is currently near the upper Bollinger Band, which often serves as a resistance level. This suggests the market is relatively high within its recent range.
Additionally, the
is above both the 20-period SMA and the 50-period SMA, indicating a bullish trend. The CMF is below the zero line, which could indicate some selling pressure or distribution. Both the K and D lines are above 80, indicating overbought conditions. This could suggest a potential pullback or consolidation in the near term. The Bitcoin price stood at $71,085 as of press time representing a 5.6% pump over the last 24 hours.
Ethereum Price Review
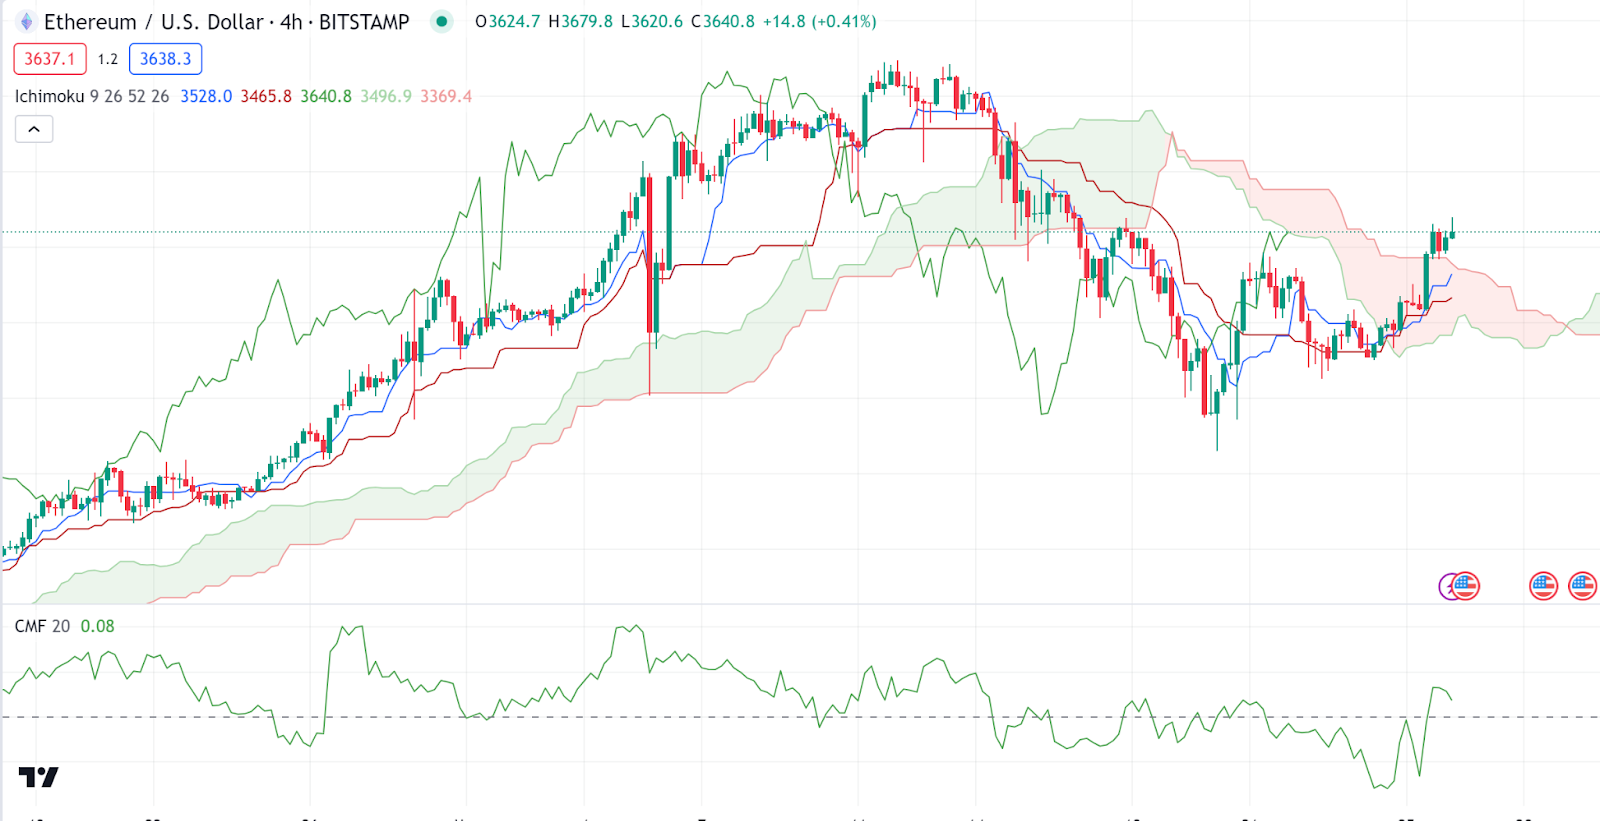
Ethereum has also not been left behind, as the altcoin king also made notable gains. The
inside the cloud indicates a potential trend change or consolidation period. The recent movement above the cloud could be seen as bullish if sustained.
The Ethereum Price action is above the blue line (likely a baseline or Kijun-sen), which may act as support. On the other hand, the Chaikin Money Flow (CMF is close to zero, indicating a balance between buying and selling pressure. The Ethereum price stood at $3,647 as of press time representing a slight 5.5% pump over the last 24 hours.
Internet Computer Price Review
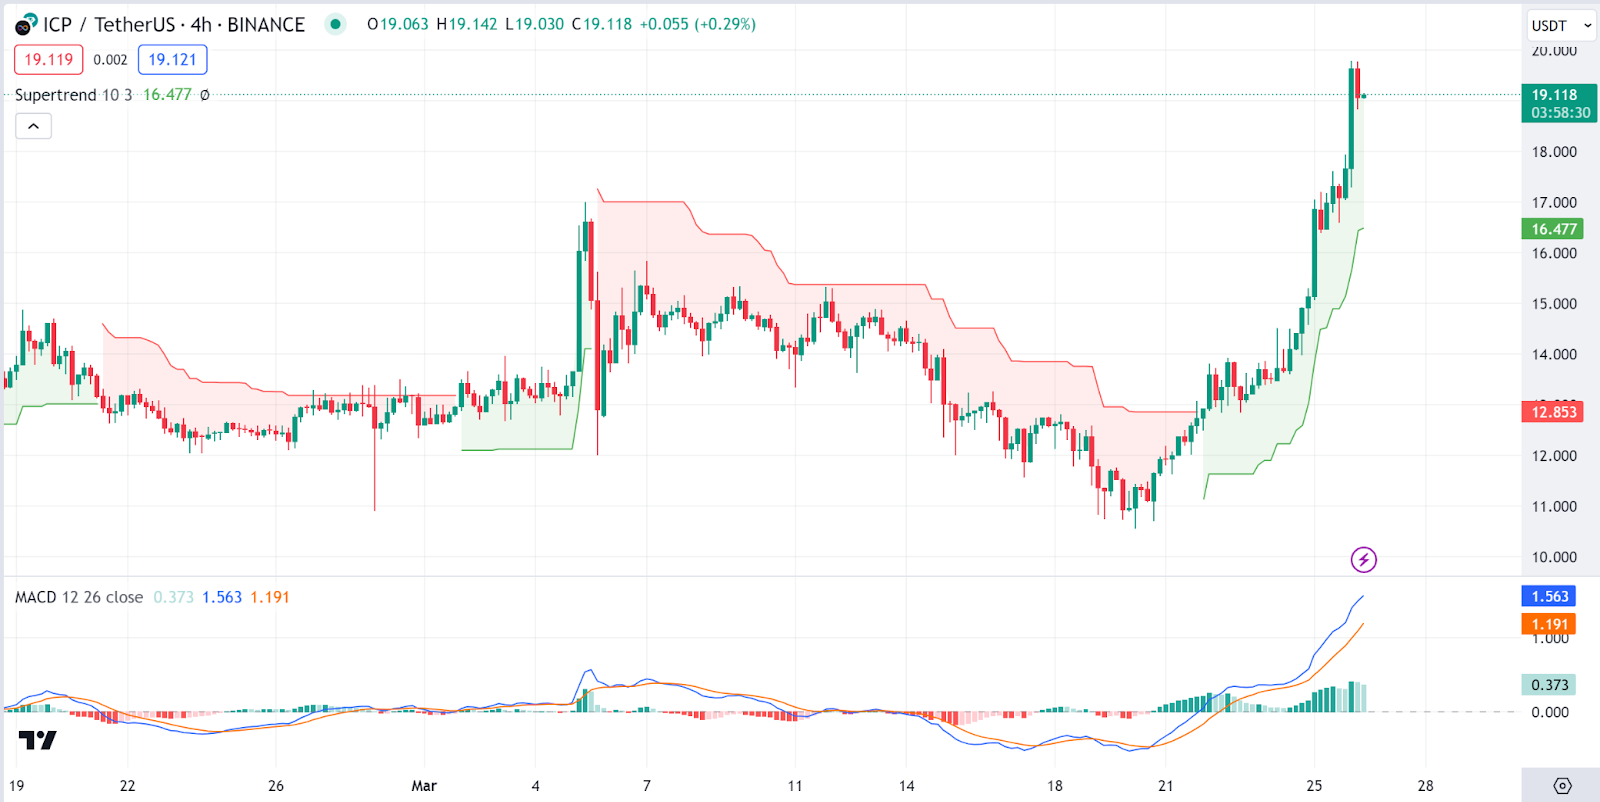
Internet Computer (ICP) continues its impressive surge as it emerged as the top gainer in today’s session. Analyzing ICP charts, we notice that the SuperTrend indicator appears to have recently flipped from bearish to bullish, which could suggest a trend reversal to the upside.
On the other hand, the Moving average convergence Divergence (MACD) line is above the signal line and the zero line, which is typically a bullish sign. The Internet Computer price stood at $19.09 as of press time representing a slight 14.7% pump over the last 24 hours.
Fetch.ai Price Review
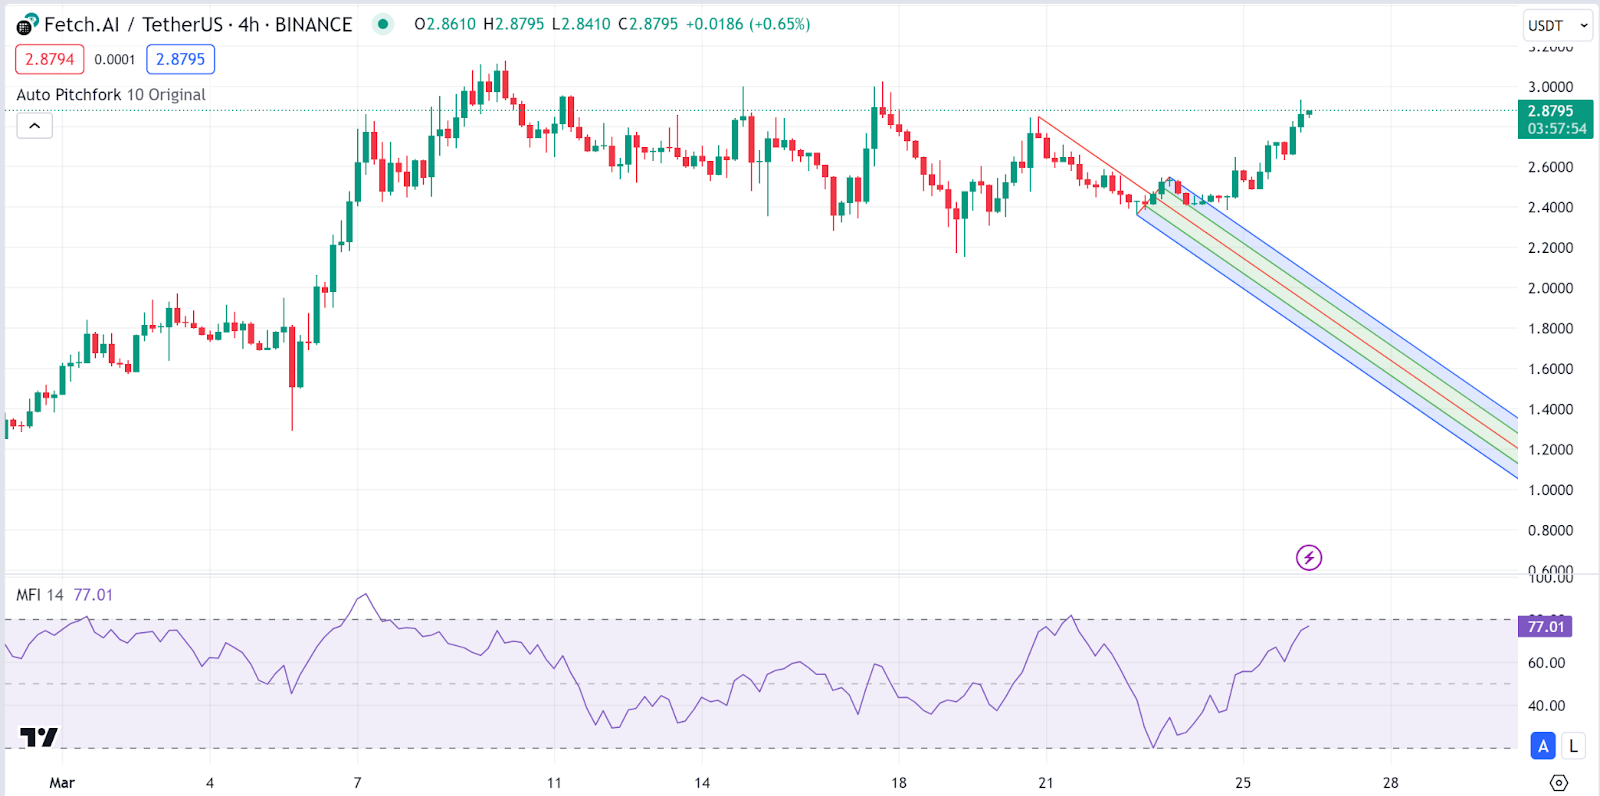
Fetch.ai (FET) is today’s second top gainer, posting remarkable gains in today’s session. Looking at the Auto Pitchfork, the Fetch.ai price has exited the bearish channel and is testing the upper boundary. This could indicate the start of a bullish trend if the price stays above the pitchfork.
Looking at the Money Flow Index (MFI), we notice it is quite high at 77, indicating that the market may be overbought. This could sometimes foreshadow a pullback. The Fetch.ai price stood at $2.89 as of press time representing a slight 13.18% pump over the last 24 hours.
Bonk Price Review
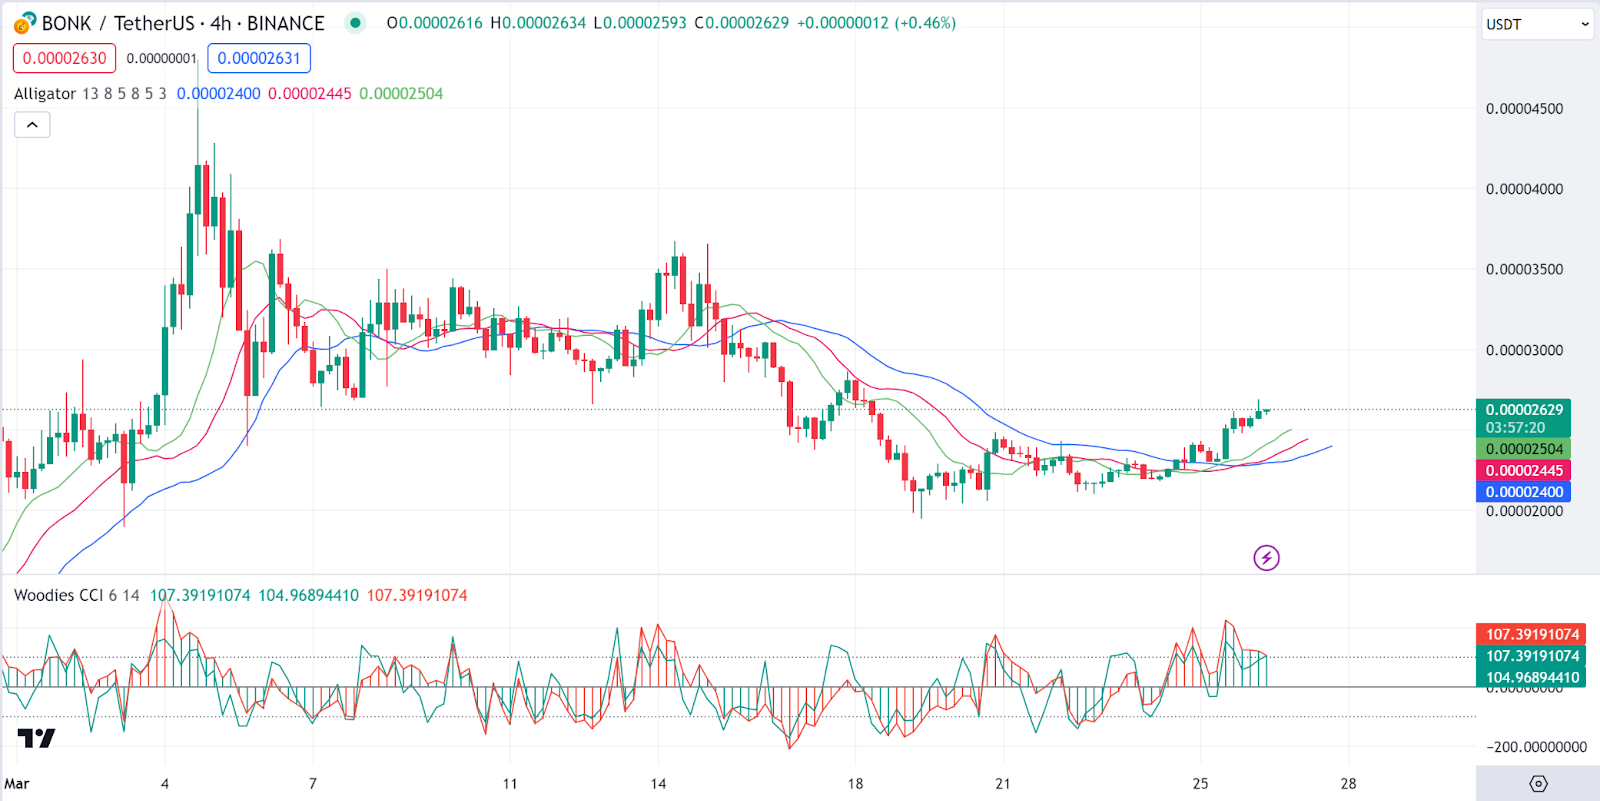
Bonk (BONK) is today’s third top gainer ahead of the uptrend. Analyzing the meme coin’s charts, we notice the Alligator Indicator lines are starting to open up with the green line (lips) moving above the red and blue lines, indicating a possible start of a bullish trend.
On the other hand, the Woodies CCI is around the zero line, indicating that the Bonk price is currently around its average price. The Bonk price stood at $2.89$0.00002635 as of press time representing a slight 13.5% pump over the last 24 hours.
Source: https://blockchainreporter.net/daily-market-review-btc-eth-icp-fet-bonk/