Bulls have started the week still on the upper edge as seen from the increasingly global market cap that has seen the total cap rise by 1.4% in the last 24 hours to stand at $2.67T as of press time while the trading volume rose by 36.6% in the last 24 hours to stand at $126.8B,
Bitcoin Price Review
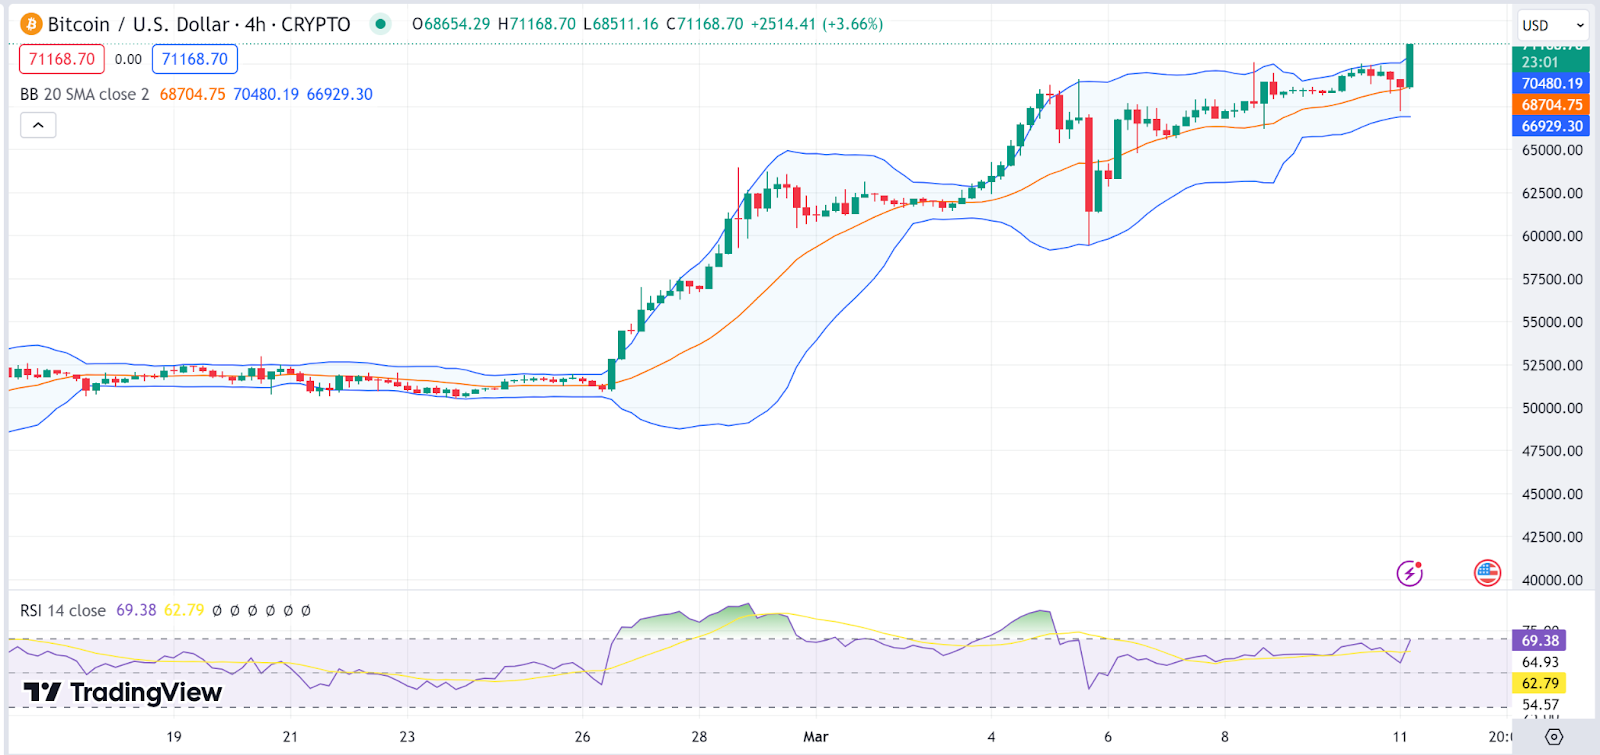
Bitcoin (BTC) has started the week on a massive bullish force as the crypto king hits a new ATH. Looking at the 4-hour BTC/USD charts, we notice the
has crossed the upper band, suggesting strong upward momentum. The RSI value is around 69 as it approaches overbought conditions.
The RSI’s movement suggests bullish activity as it heads for the overbought region. The Bitcoin price stood at $71K as of press time, representing a 2.4% pump in the last 24 hours as the crypto king surges again.
Ethereum Price Review
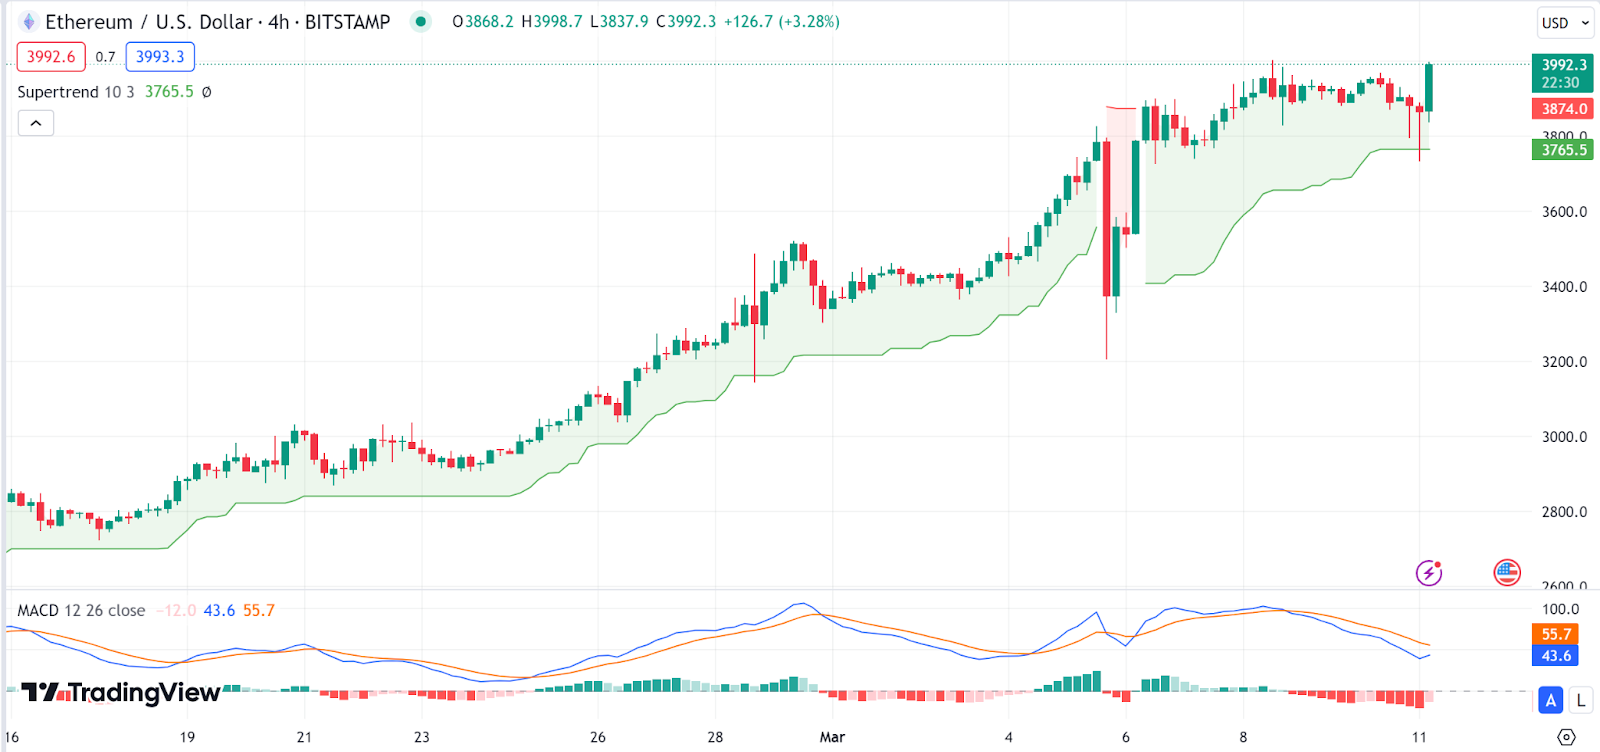
Ethereum has also started strongly as it also crosses $4K to set a new ATH. The Supertrend indicator is below the
and green in color, suggesting a bullish trend. The Ethereum price has been in an uptrend as shown by the latest series of green candle sticks alongside consistent higher highs and higher lows over the period displayed.
The MACD indicator, currently in the red zone, is reverting towards the green zone, showing a change in momentum from bearish to bullish. The Ethereum price stood at $4005 as of press time, representing a 1.27% pump in the last 24 hours.
FLOKI Price Review
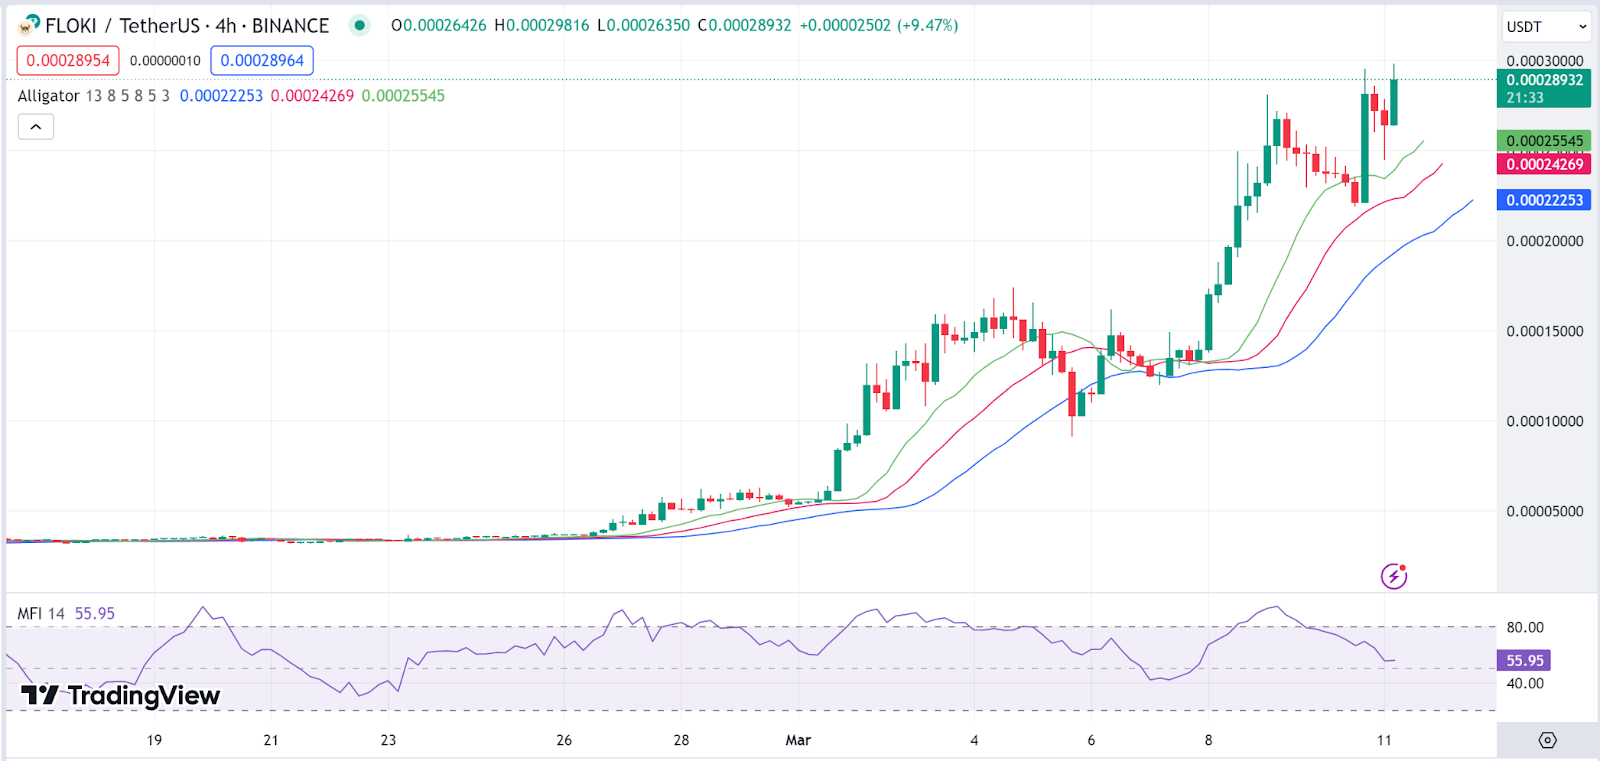
FLOKI is showing no signs of slowing down as the meme coin emerges as the top gainer again. The Alligator indicator, which is a collection of moving averages, suggests a bullish trend with the green line (lips) above the red line (teeth) and the blue line (jaw).
The Money Flow Index (MFI), which is at 55, is now deviating from its southern trajectory to a northern one. This indicates mounting buying pressure. The FLOKI price stood at $0.0002806 as of press time, representing a 20% pump in the last 24 hours.
Gala Price Review
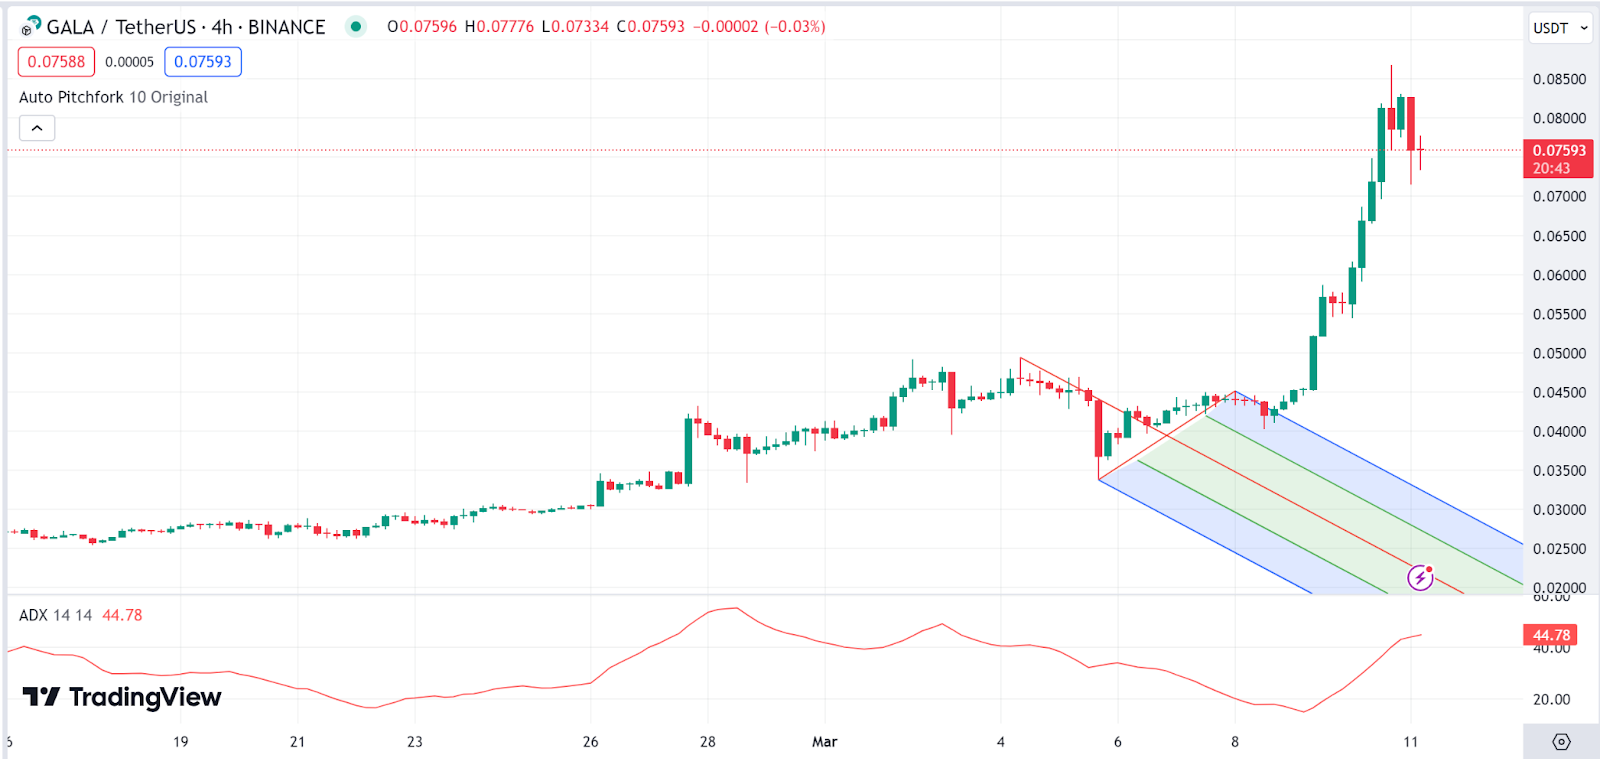
Gala has emerged as today’s second top gainer ahead of impressive pumps. The Gala chart shows that the Gala price is within the upper half of the pitchfork but shows a couple of bearish candle sticks, as the token now faces some consolidation with bulls and bears struggling for dominance
The ADX is currently at a value of 44.7, which indicates a rather strong trend. Generally, an ADX value above 25 suggests that the market is trending, and the higher the value above 25, the stronger the trend. The rising ADX in the context of a rising price suggests that the uptrend is strong. The Gala price stood at $0.0745 as of press time, representing a 11.8% pump in the last 24 hours.
Near Protocol Price Review
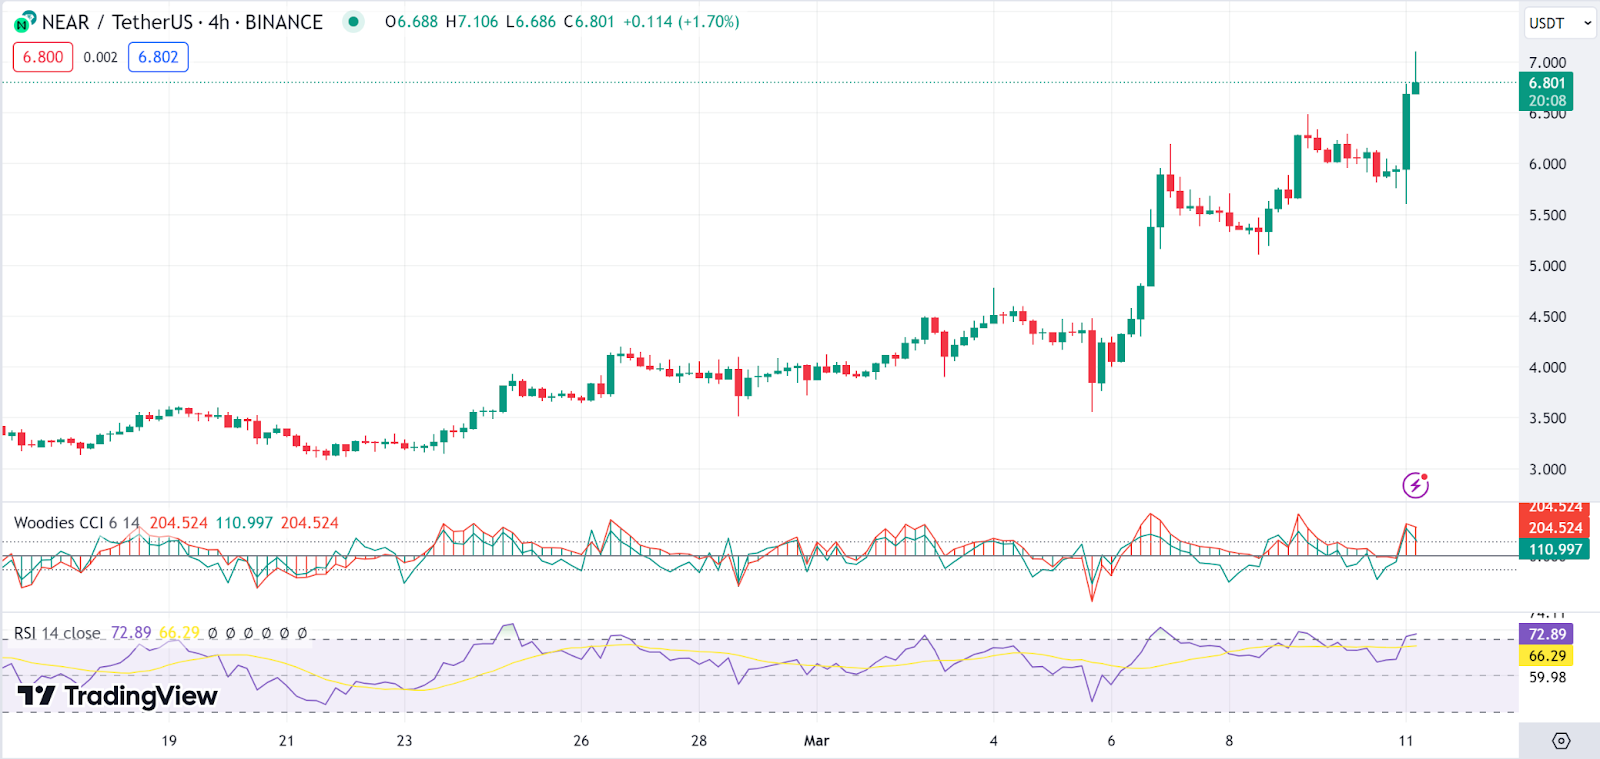
Near Protocol (NEAR) is today’s third topmost gainer. We notice that the CCI line (turquoise) is above the signal line (red), which typically suggests bullish momentum as evidenced by the latest series of green candle stick patterns.
The Relative strength index, currently in a north trajectory, is in the overbought region suggesting bullishness on the token. However, the overbought conditions could warrant looming corrections in the short term. The Near Protocol price stood at $6.8 as of press time, representing a 12% pump in the last 24 hours.
Source: https://blockchainreporter.net/daily-market-review-btc-eth-floki-gala-near/