Markets seem to have entered into a correction phase as seen from the sharp decline in the global market cap over the last 24 hours. The global market cap stood at $2.57T as of press time representing a 6.9% drop over the period.
Bitcoin Price Review
is facing massive corrections as the crypto king now trades below $69K. The Supertrend indicator is currently showing a sell signal as the Bitcoin price is below the green Supertrend line indicating massive corrections on BTC.
The RSI is near the 37 level, which is closer to the oversold territory but not quite there yet, indicating some bearish momentum. However, its northern trajectory could now show some bullish resurgence. The Bitcoin price stood at $68.2K as of press time representing a 7% drop over the last 24 hours.

Ethereum Price Review
has also fallen prey to the corrections as it also goes below $4K. The price has recently moved below the 20-period SMA (middle Bollinger Band), showing bearish momentum as characterized by the lates series of red candlesticks.
The MACD line is below the signal line and has been descending, which supports the bearish view. The Ethereum price stood at $3739 as of press time representing a 5% drop over the last 24 hours.

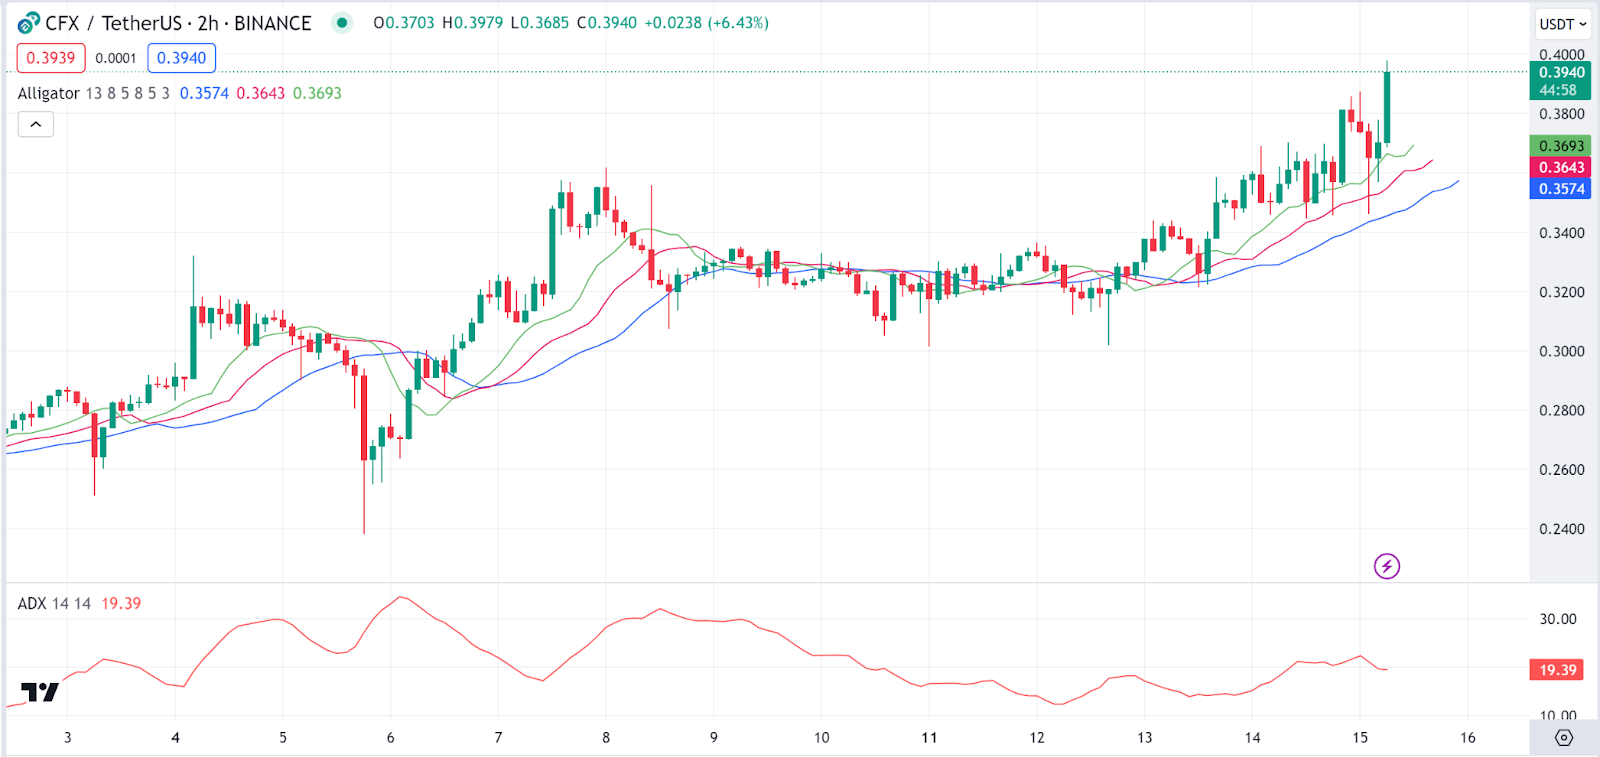
Conflux Price Review
Despite today’s downtrend, Conflux (CFX), has managed to post some notable gains to become today’s top gainer. Looking at the Williams Alligator, we notice the Conflux price is above the Alligator’s lips (the green line), suggesting a potential bullish trend.
On the other hand, the Average Directiona Index (ADX), an indicator used in gauging trends, is around 19.39, which suggests a relatively weak trend. The Conflux price stood at $0.3973 as of press time representing a 12% pump over the last 24 hours ahead of the gains.
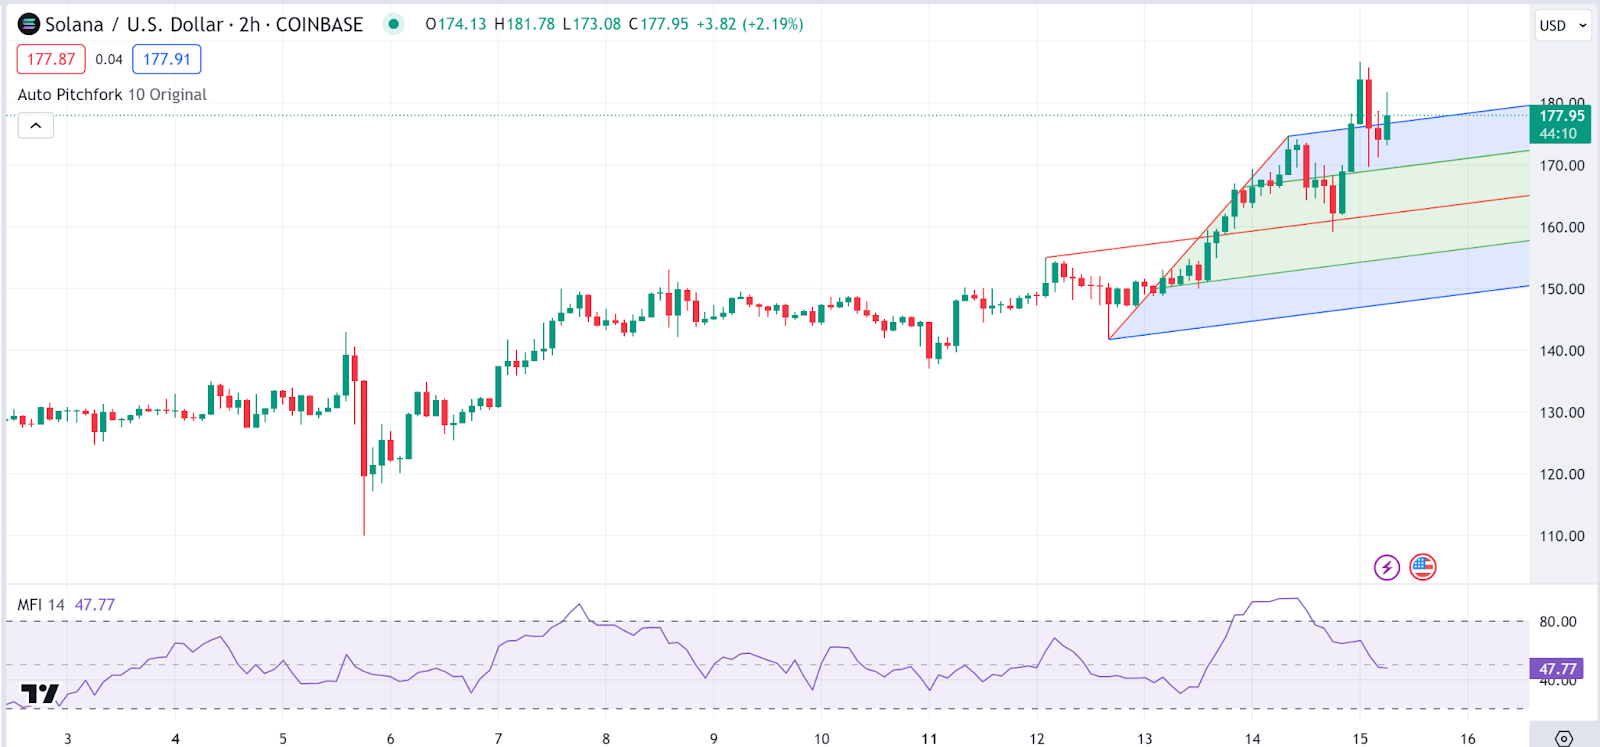
Solana Price Review
has also posted some gains to emerge among today’s top gainers. Looking at Solana charts, we notice the price is within the pitchfork, indicating that it’s following a trend channel, and it is currently at the upper half, suggesting bullish control.
The Money Flow Index (MFI) is around 47.77, near the middle range, which does not indicate overbought or oversold conditions. However, its deviation from its southern trajectory could imply mounting buying pressure. The Solana price stood at $176.95 as of press time representing a 5% jump over the last 24 hours.
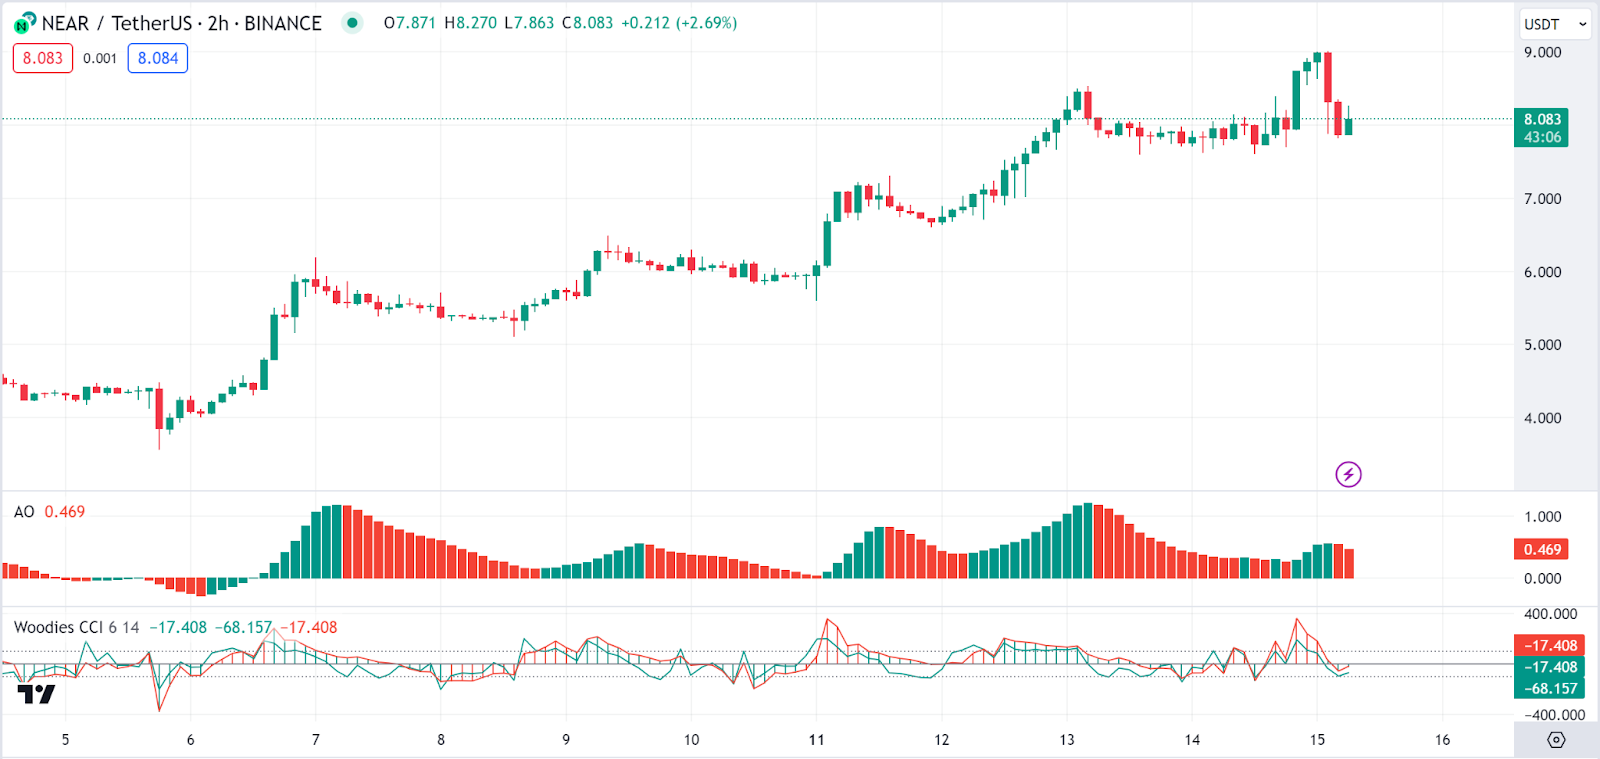
Near Protocol Price Review
Near Protocol (NEAR) is the third top gainer in today’s session. Looking at Near Protocol price charts, we notice that the Awesome Oscillator (AO), used in gauging trends, is above zero but seems to be decreasing, indicating that the bullish momentum may be waning.
However, despite today’s gains, the CCI is below the zero line and has been descending, indicating bearish momentum. It’s approaching the oversold area but isn’t quite there yet cautioning for possible corrections. The Near Protocol price stood at $8.04 as of press time representing a 3.4% jump over the last 24 hours.
Source: https://blockchainreporter.net/daily-market-review-btc-eth-cfx-sol-near/