Bulls still have a firm grip on the markets, as shown by the current market cap, which is 5.9% above the previous 24-hour cap. The global market cap stood at an impressive $2.32T as of press time.
Bitcoin Price Review
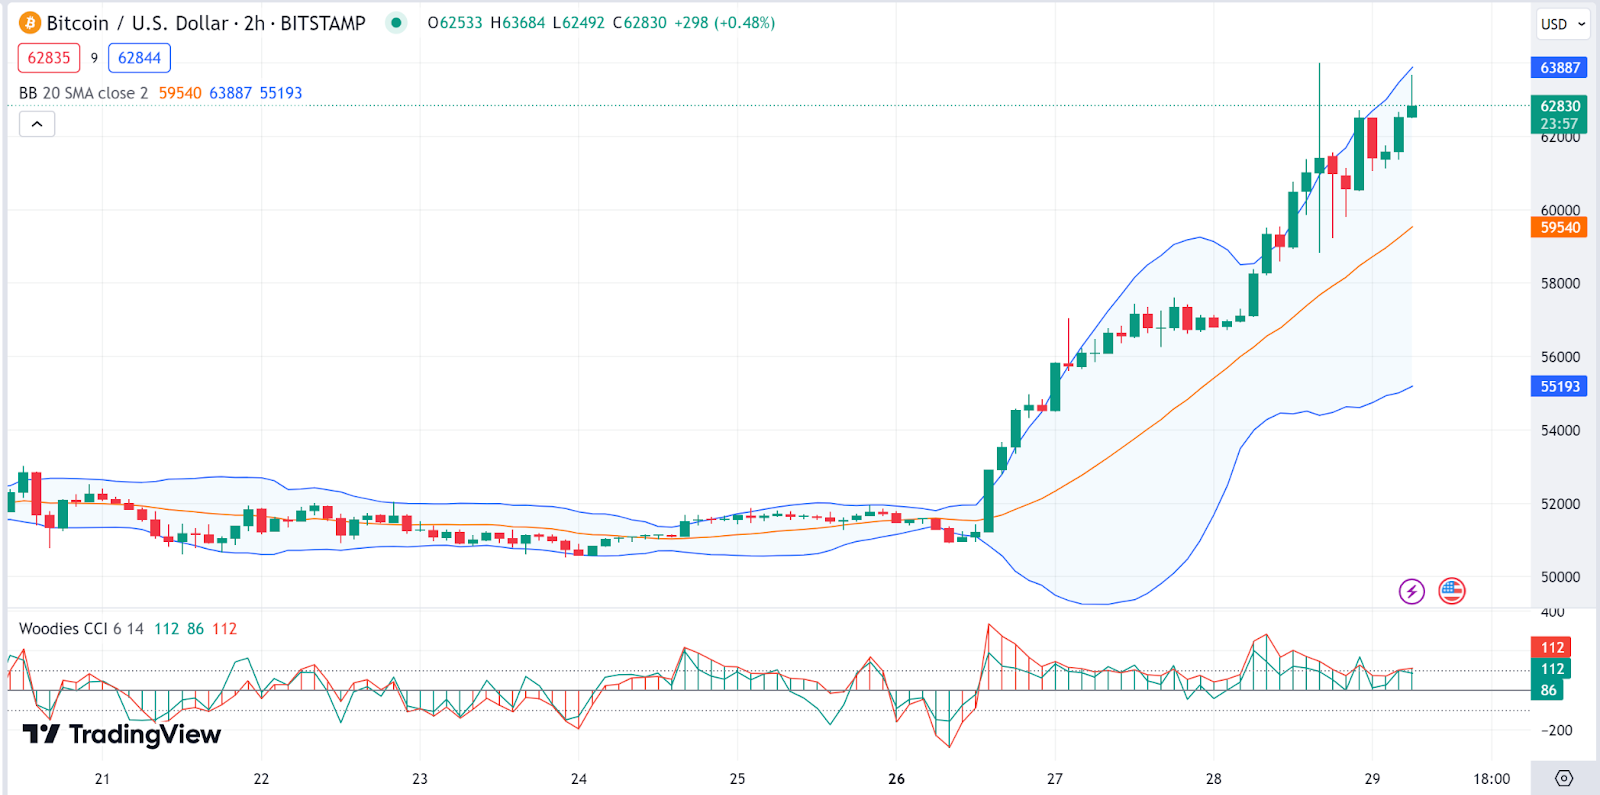
The Bitcoin (BTC) chart shows a strong uptrend indicated by consistently higher highs and higher lows. The Bollinger Bands are widening, suggesting increasing volatility as the Bitcoin price moves upwards.
The Bitcoin price is currently trading near the upper Bollinger Band, which could indicate that
is potentially overbought in the short term. The moving average (orange line) is trending upwards, and the Bitcoin price is above it, confirming the bullish trend. The Woodies CCI fluctuates around the zero line, showing some indecision in the short term, but remains in generally bullish territory. The Bitcoin price stood at $62.9K as of press time, representing a 7.2% pump in the last 24 hours.
Ethereum Price Review
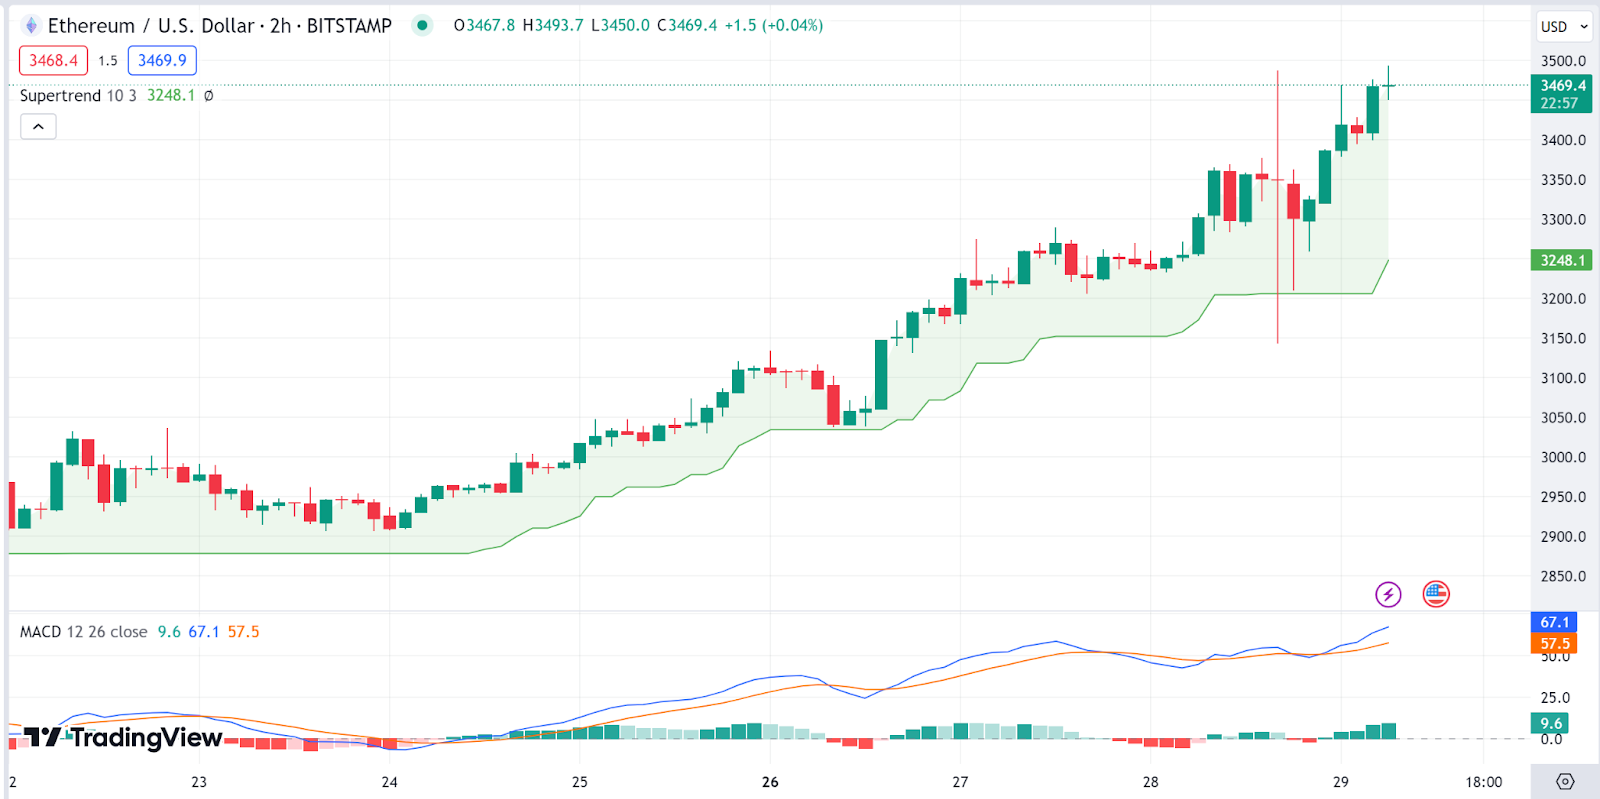
chart also shows an uptrend, with the Ethereum price trading above the green Supertrend line, indicating a bullish phase. The Moving Average Convergence Divergence (MACD) is above the signal line and positive, which is a bullish signal.
The MACD histogram is also positive, indicating strong momentum on the Ethereum price trajectory. The Ethereum price stood at $3460 as of press time, representing a 4.3% pump in the last 24 hours.
Bonk Price Review
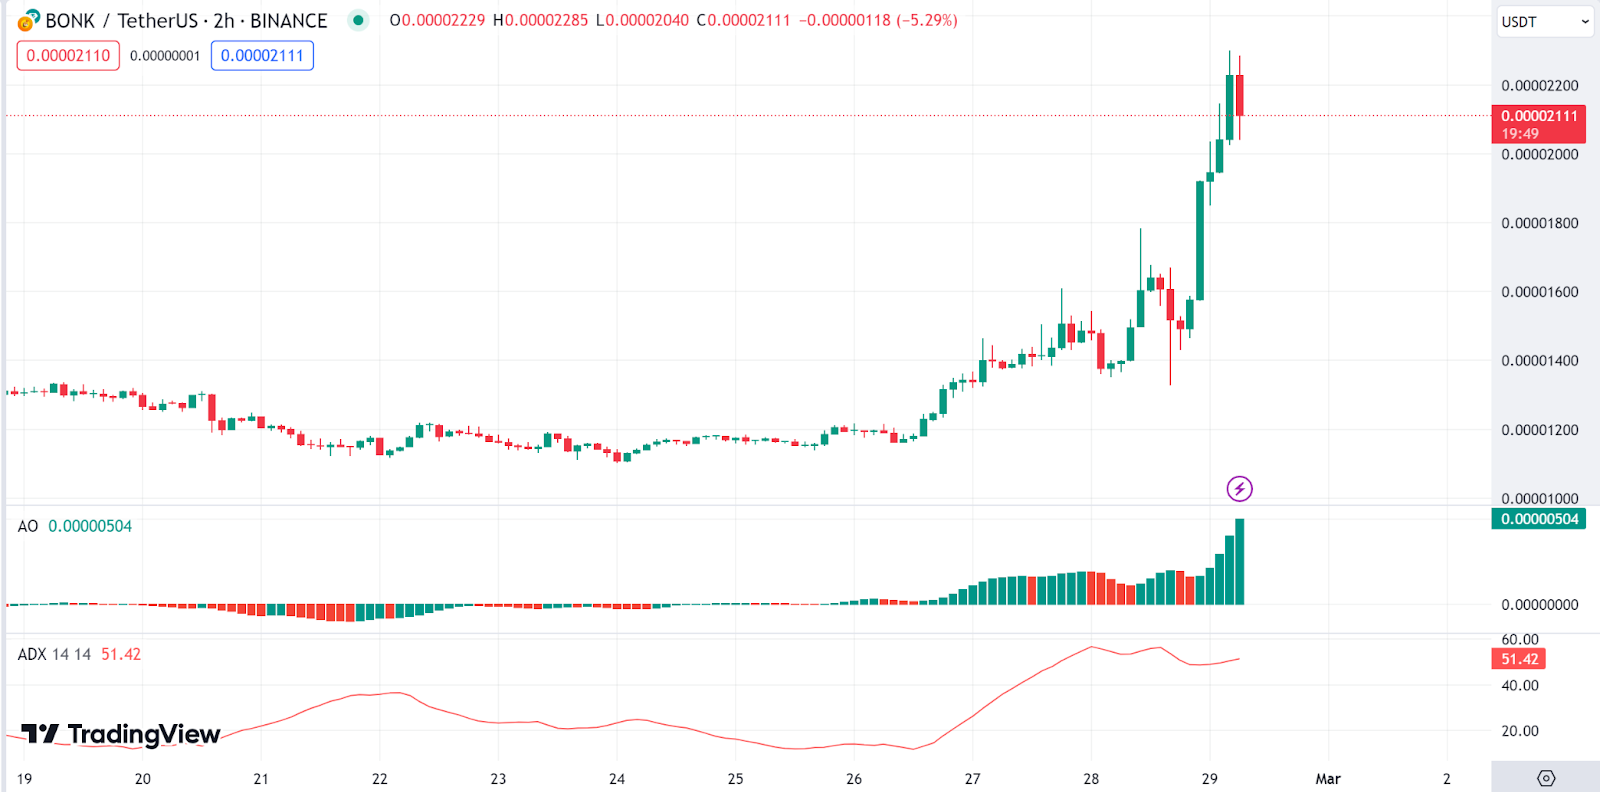
Bonk (BONK) is today’s top gainer as meme coins take center stage. BONK has experienced a sharp price increase, as the long green candles indicate. The Awesome Oscillator (AO) shows a strong bullish momentum as the green bars increase in height.
The Average Directional Index (ADX) is above 25, suggesting a solid trend. However, the ADX line is flat, which may indicate the trend strength is not increasing. The Bonk price stood at $0.00002161 as of press time, representing a 53.7% pump in the last 24 hours.
Dogecoin Price Review
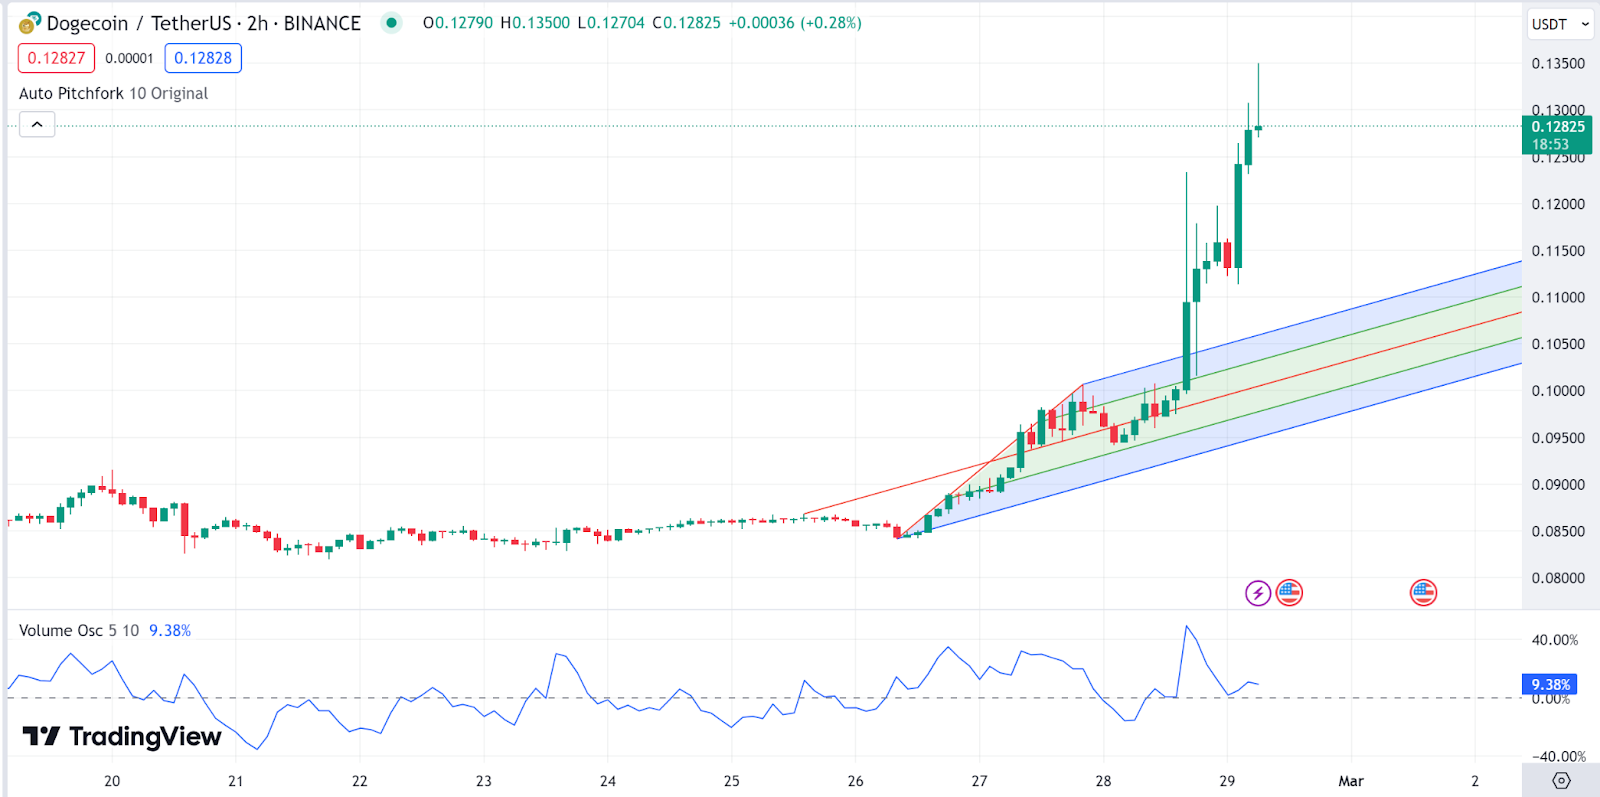
is the second top gainer today as seen from our analysis. The chart shows a strong bullish trend, with Dogecoin price consistently making higher highs. The Auto Pitchfork tool shows the Dogecoin price trading in the upper half of the pitchfork, indicating strong buying pressure.
The Volume Oscillator is positive, suggesting that volume is increasing on up days, which supports the bullish Dogecoin price action. The Dogecoin price stood at $0.1265 as of press time, representing a 26.2% pump in the last 24 hours.
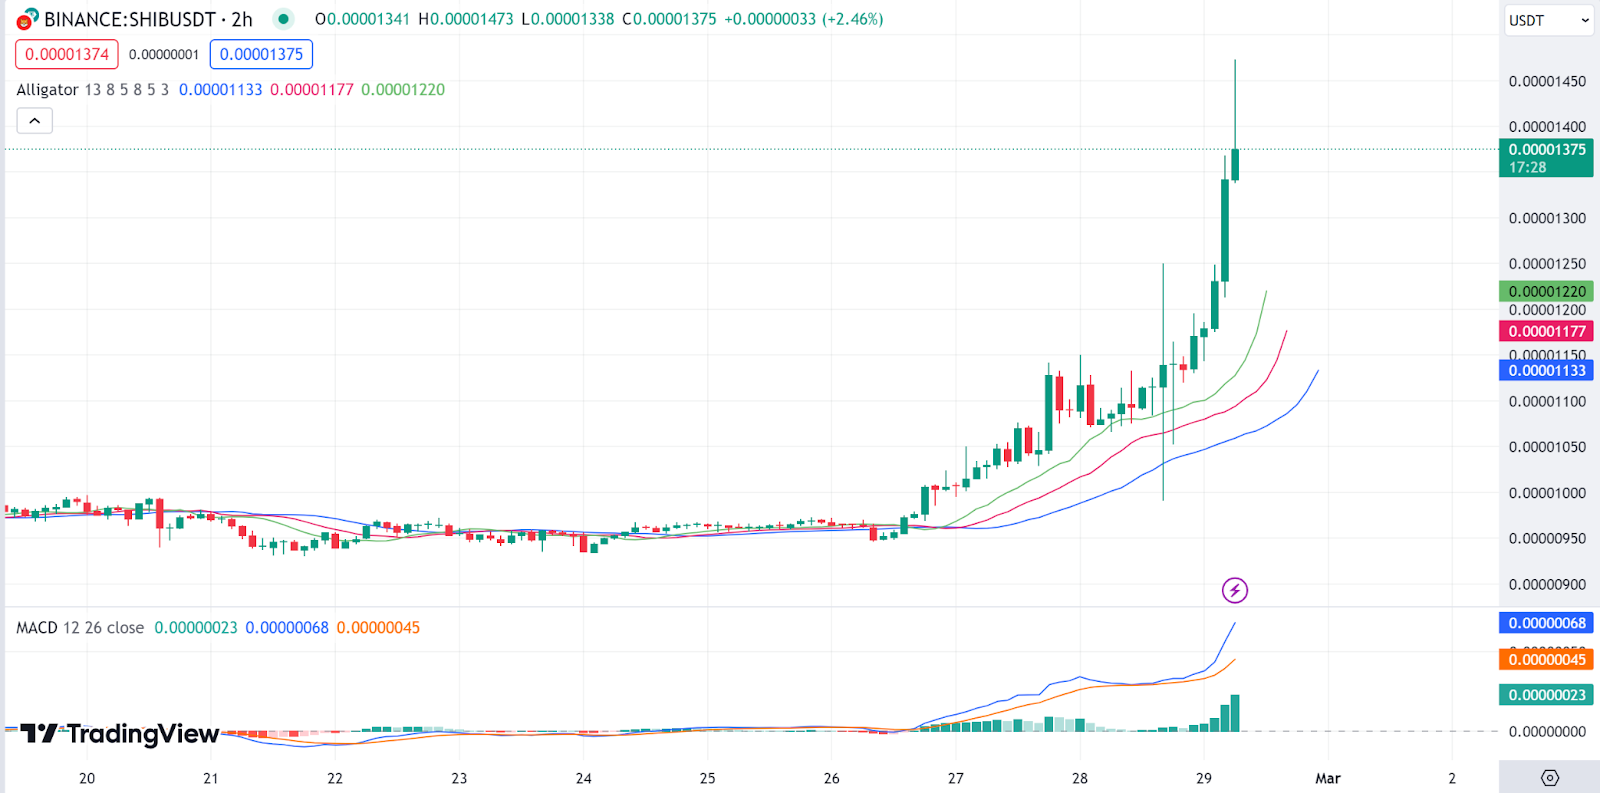
Shiba Inu Price Review
is the third and our last top gainer today. SHIB is showing a parabolic rise with the price moving sharply away from the moving averages. The Alligator indicator is in a bullish formation, with the green, red, and blue lines (jaw, teeth, and lips) nicely fanned out and the Shiba Inu price above all three.
The MACD is far above the signal line and the histogram bars are growing, indicating strong bullish momentum. The Shiba Inu price stood at $0.00001363 as of press time, representing a 25.67% pump in the last 24 hours.
Source: https://blockchainreporter.net/daily-price-review-btc-eth-bonk-doge-shib/