As seen from the increasing global market cap, markets are riding on bull activity today. Standing at $2.64T as of press time, the global market cap had risen by 3.6% from the last 24 hours while the trading volume dropped by 28% over the same period to $151 billion.
Bitcoin Price Review
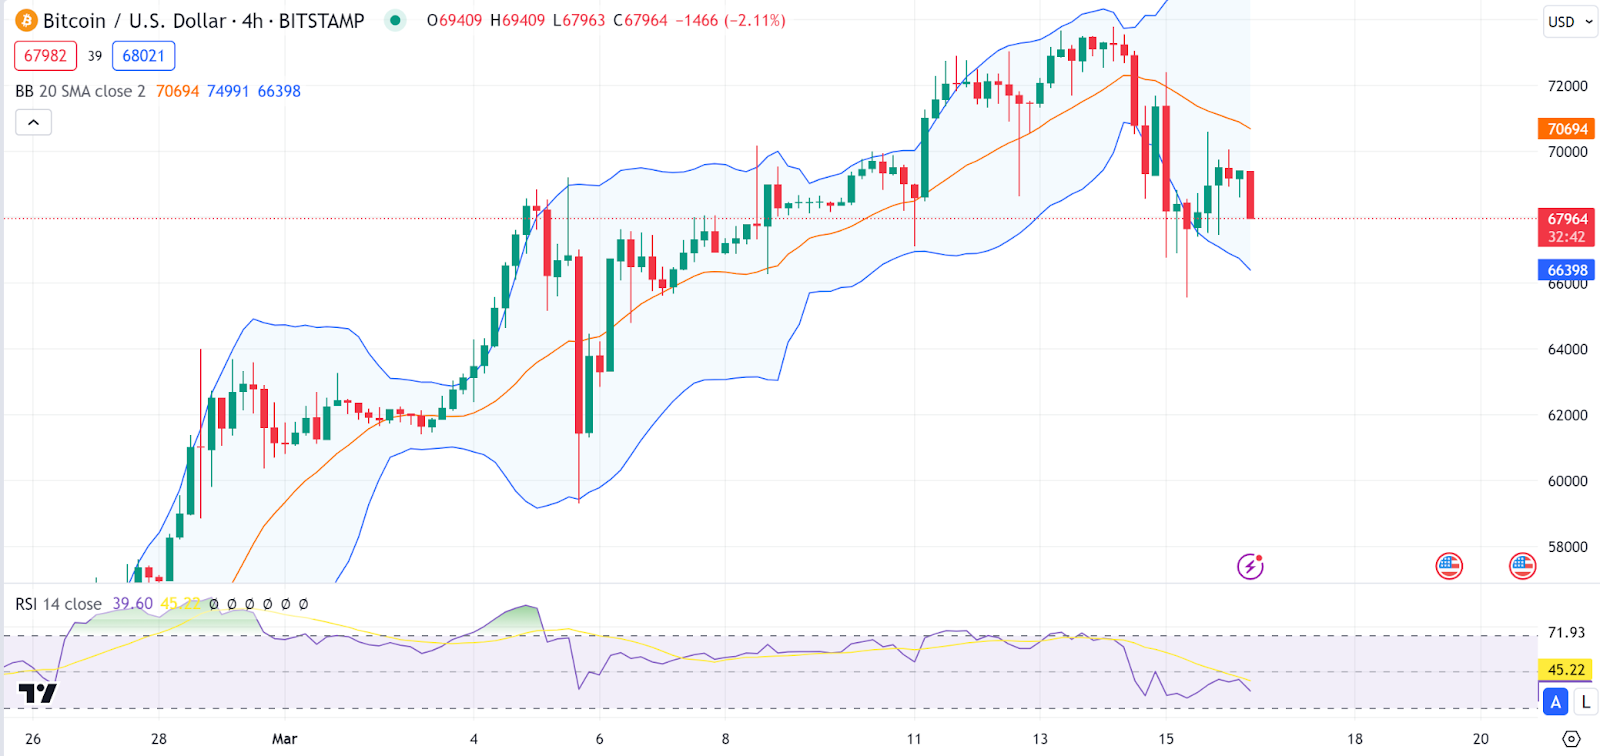
Today, markets are showing some resurgence as Bitcoin (BTC) manages a slight comeback. Looking at the Bollinger Bands, we notice the
is between the middle and lower bands, indicating potential downward pressure.
The Relative Strength Index (RSI) is slightly above the 30 mark, often considered oversold territory, suggesting potential for a reversal or pullback. The Bitcoin price stood at $68.4K as of press time representing a 1.2% pump over the last 24 hours.
Ethereum Price Review
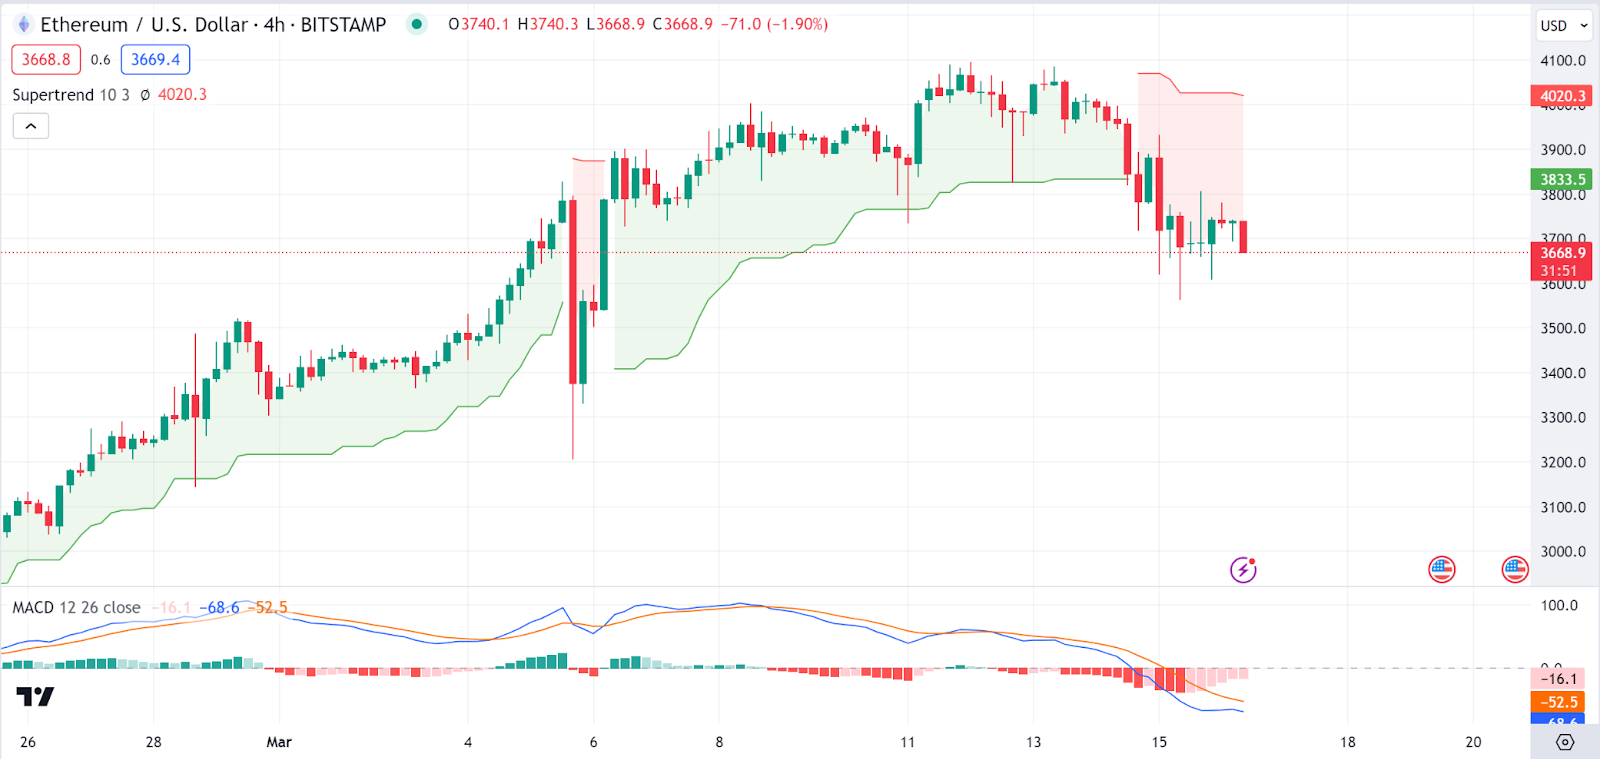
Ethereum (ETH) also managed slight gains during today’s session. Looking at the Ethereum charts, we notice that the
is below the Supertrend line, indicating a bearish trend. This could mean another price drop in the short term.
On the other hand, looking at the Moving Average Convergence Divergence (MACD), we see the MACD line is below the signal line and both are trending downwards, suggesting bearish momentum. Despite the bear sentiment, the Ethereum price stood at $3,693, representing a 0.4% pump over the last 24 hours.
BOOK OF MEME Price Review
BOOK OF MEME is today’s top gainer as the meme coin takes markets by storm to enter the top 100 coins by market cap within 48 hours of launch.
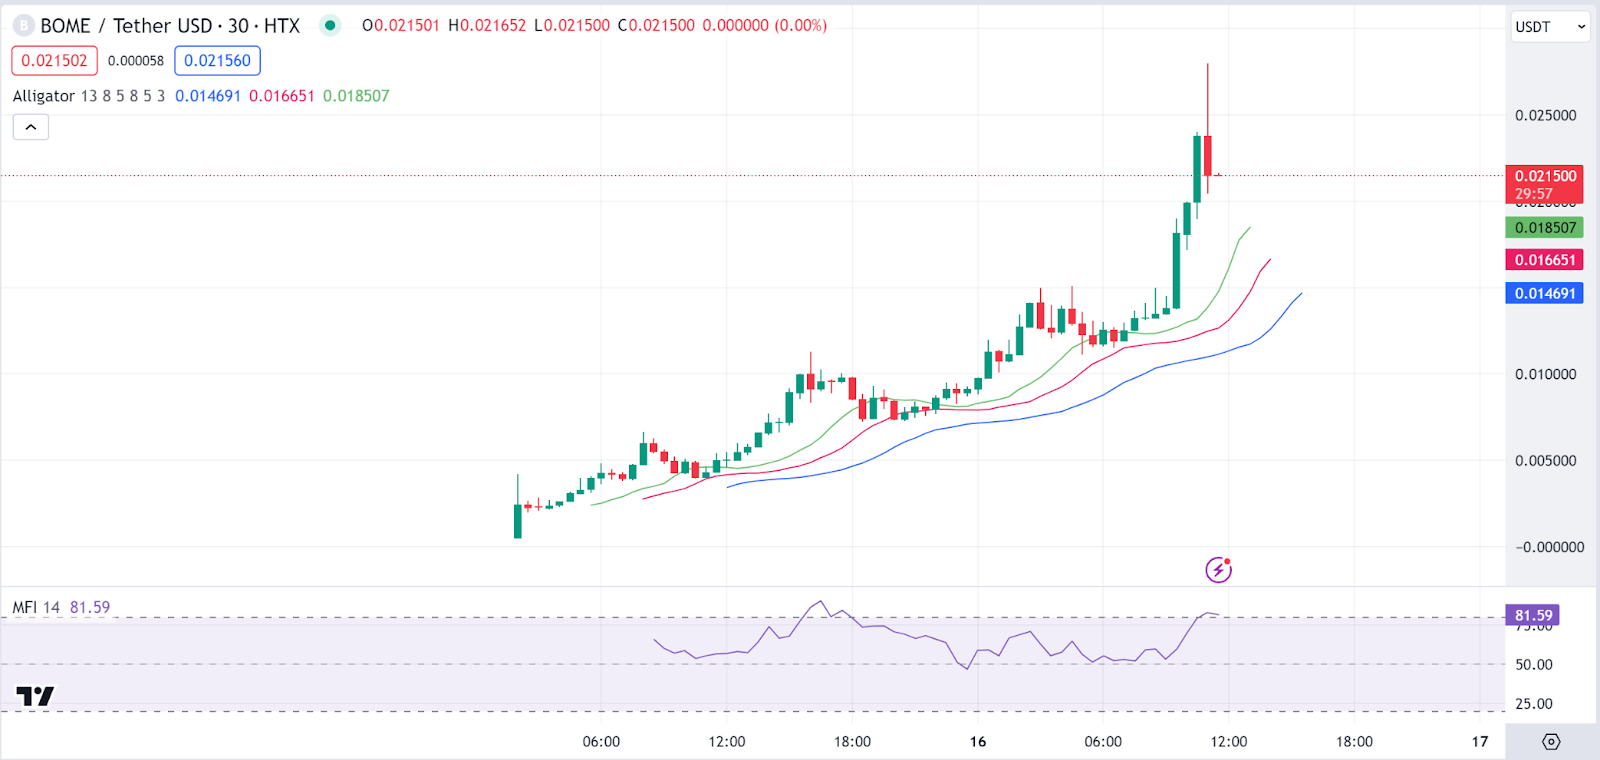
Looking at the charts, we notice the BOME price is above all three lines of the Alligator, indicating a bullish trend. However, the red candlestick suggests a recent pullback cautioning for price drops amid the massive pump.
Additionally, the Money Flow Index (MFI) is extremely high, above 80, which might indicate that the asset is overbought and could face a correction. The BOME price stood at $0.02198, representing an impressive 368% pump over the last 24 hours.
Jupiter Price Review
Jupiter is today’s second top gainer as it also managed notable gains. Analysing JUP/USDT charts, we see the Jupiter price is near the upper boundary of the pitchfork, which could serve as a resistance level.
On the other hand, the Commodity Channel Index (CCI) is above 100, suggesting that the asset may be overbought and at risk of a pullback. The Jupiter price stood at $1.47, representing a 57.9% pump over the last 24 hours.

Pyth Network Price Review
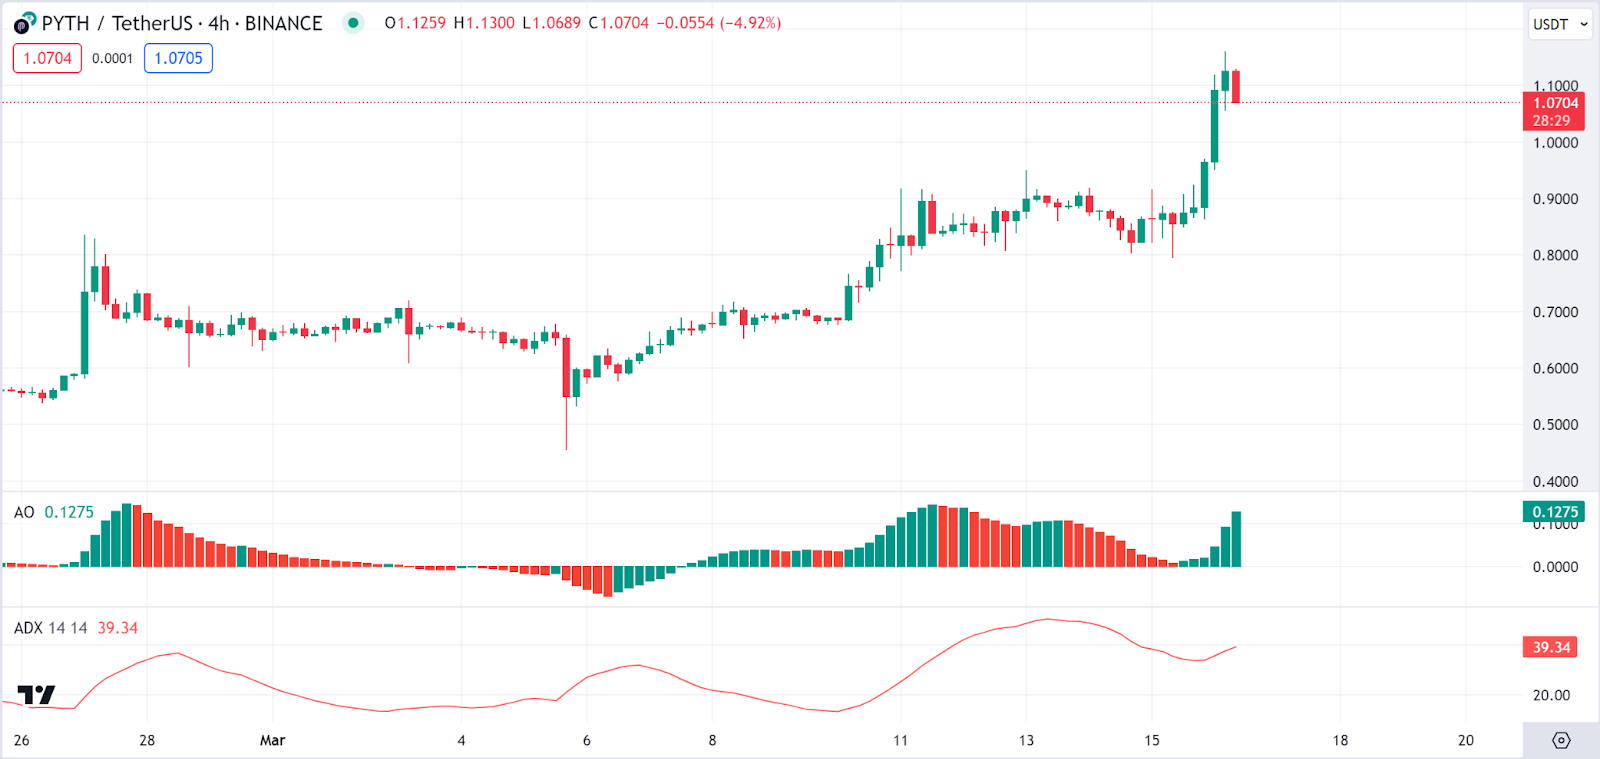
Pyth Network (PYTH) is another gainer today, showing strong bullish activity. Looking at the Awesome Oscillator (AO), an indicator used in gauging market trends, we see green bars above the zero line, which could indicate bullish momentum.
The Average Directional Index (ADX), another indicator used in gauging trends, is around 40, which indicates a strong trend. The positive DI is above the negative, suggesting an upward trend. The Pyth Network price was $1.07, representing a 25.5% pump over the last 24 hours.
Source: https://blockchainreporter.net/daily-market-review-btc-eth-bome-jup-pyth/