Markets are riding on bullish activity as seen from the global market cap which has seen a 1.95% increase within the last 24 hours to stand at $2.57 as of press time while the trading volume dropped by 16% to $125B.
Bitcoin Price Review
bulls are still dominant as the crypto king continues to display incredible momentum. The RSI, currently at 61, is headed north showing tremendous bull momentum on the Bitcoin price.
The ADX value is, however at 20, showing the current trend is rather weak. With the RSI approaching overbought conditions, retractions in the short term are likely. The Bitcoin price stood at $68K as of press time, representing a 1.45% pump in the last 24 hours.

Ethereum Price Review
The
chart shows a strong uptrend indicated by consistently higher highs and higher lows. The Bollinger Bands are widening, suggesting increasing volatility as the Ethereum price moves upwards.
The Ethereum price is currently trading near the upper Bollinger Band, which could indicate that Ethereum is potentially overbought in the short term. The moving average (orange line) is trending upwards, and the Ethereum price is above it, confirming the bullish trend. The MACD is also in the green zone supporting the bullish prospects. The Ethereum price stood at $3972 as of press time, representing a 3.8% pump in the last 24 hours.

Aptos Price Review
Aptos (APT) is now facing corrections amid the recent pumps witnessed in the markets. The chart initially showed a strong bullish trend, with Aptos price consistently making higher highs. The Auto Pitchfork tool shows the Aptos price trading in the upper half of the pitchfork, indicating some buying pressure.
However, the recent downtrend categorized by the latest series of red candle sticks cautions on corrections. This is supported by the Awesome Oscillator whose histograms are decreasing in size as they turn red indicating building bear momentum. The Aptos price stood at $13.11 as of press time, representing a 4% dump in the last 24 hours.

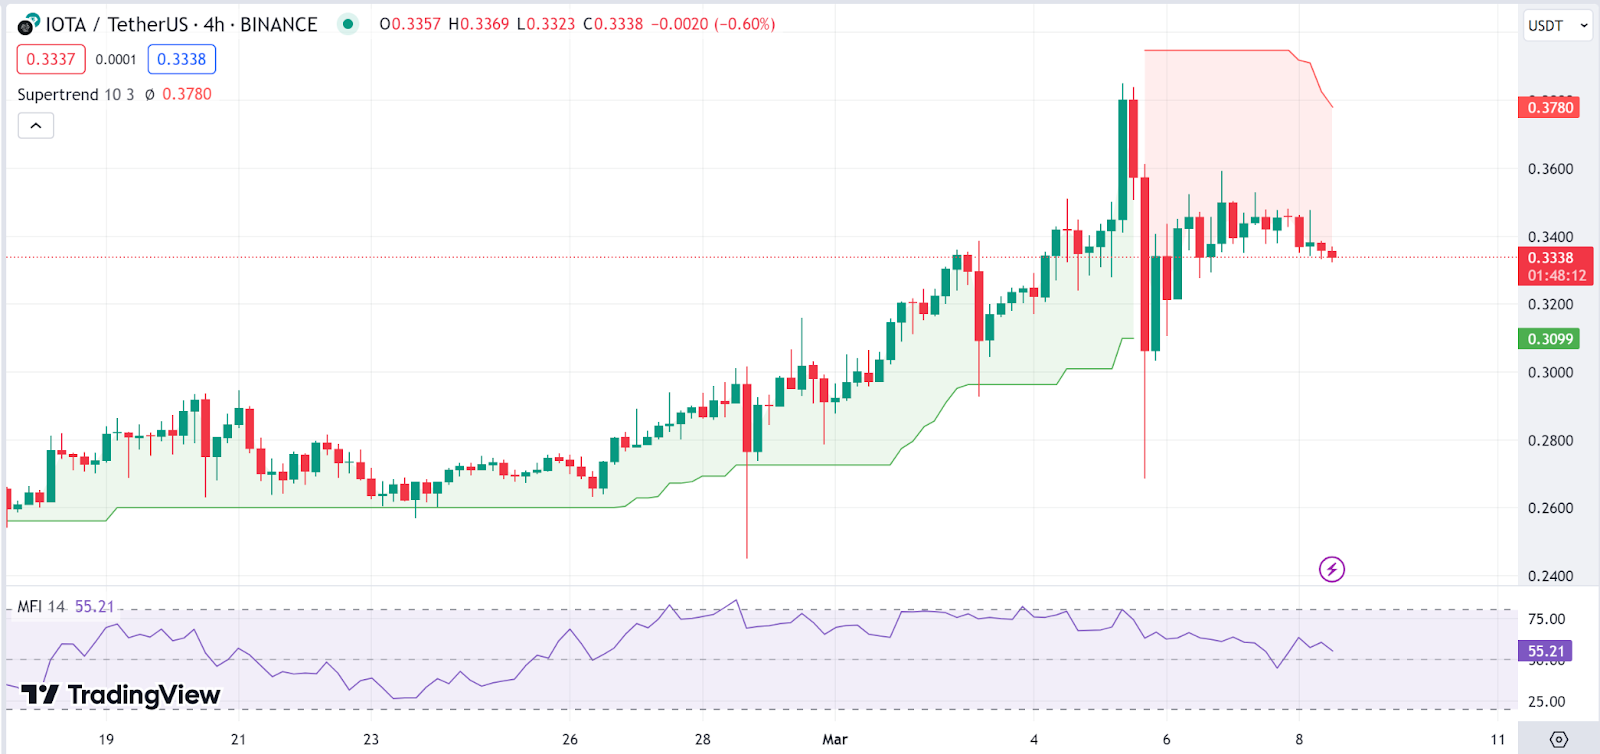
IOTA Price Review
IOTA is also facing corrections amid the recent pumps. The IOTA chart also shows a recent downtrend, with the IOTA price trading below the red Supertrend line, indicating a bearish phase.
The Money Flow Indes indicators, also at 55, have diverted to a southern trajectory indicating fading buying pressure amid the corrections. The IOTA price stood at $0.333 as of press time, representing a 3% dump in the last 24 hours.
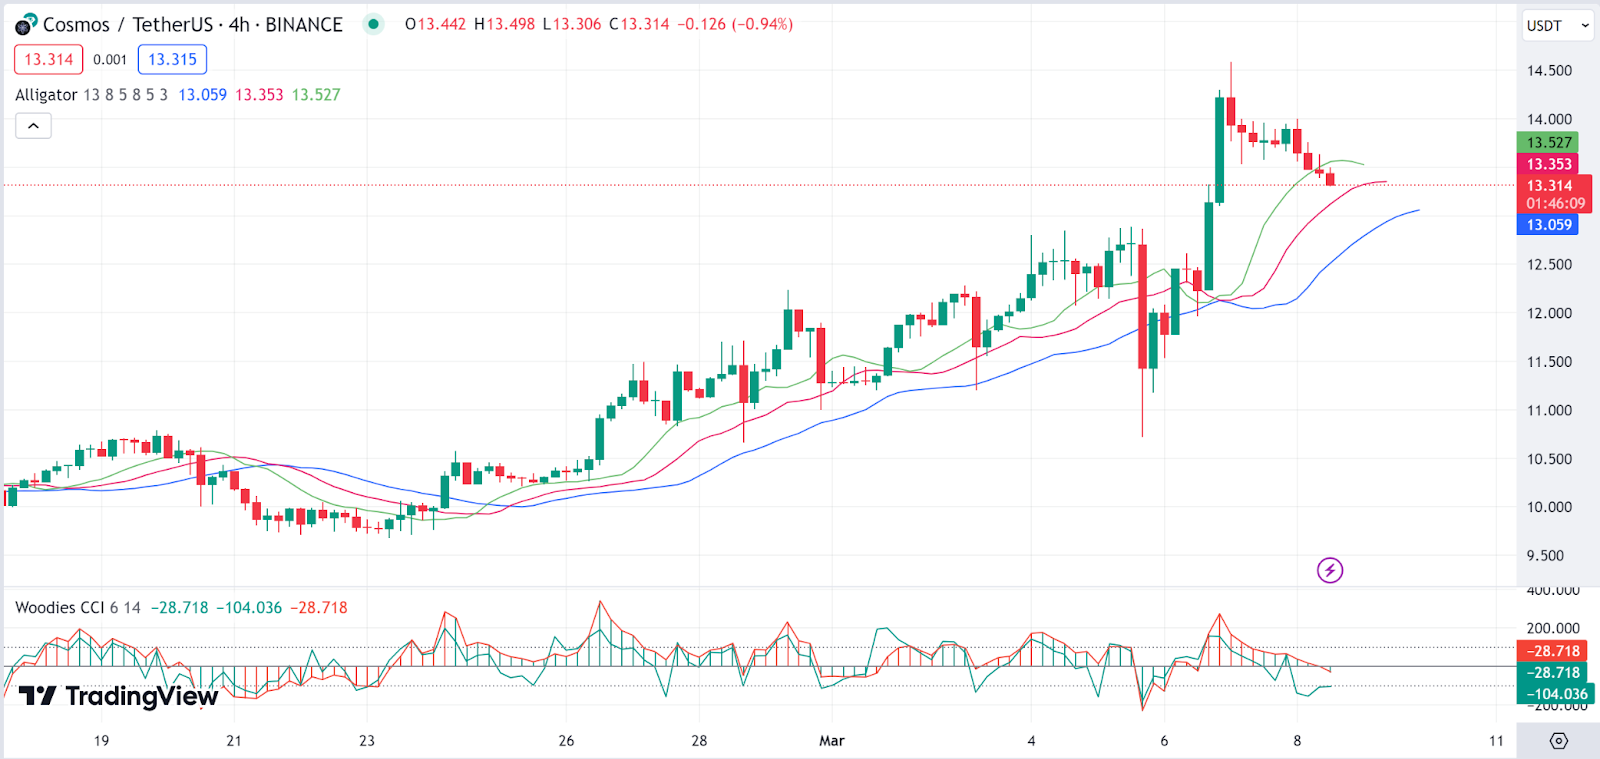
Cosmos Price Review
Cosmos (ATOM) has also fallen prey to corrections amid its recent pumps as shown by the recent series of red candle stick patterns. The Alligator indicator is in a bearish formation, with the green, red, and blue lines (jaw, teeth, and lips) retracting from their northern trajectory and the Cosmos price moving below the green line.
The Woodies CCI is below the zero line, showing bearishness in the short term. The Cosmos price stood at $13.36 as of press time, representing a 3.66% drop in the last 24 hours.
Source: https://blockchainreporter.net/daily-price-review-btc-eth-apt-iota-atom/