At the time of writing, Bitcoin is trading at $16,100. The following looks at the worst-case scenario in the short term, given the market’s broad pessimistic sentiment.
Technical Analysis
By Grizzly
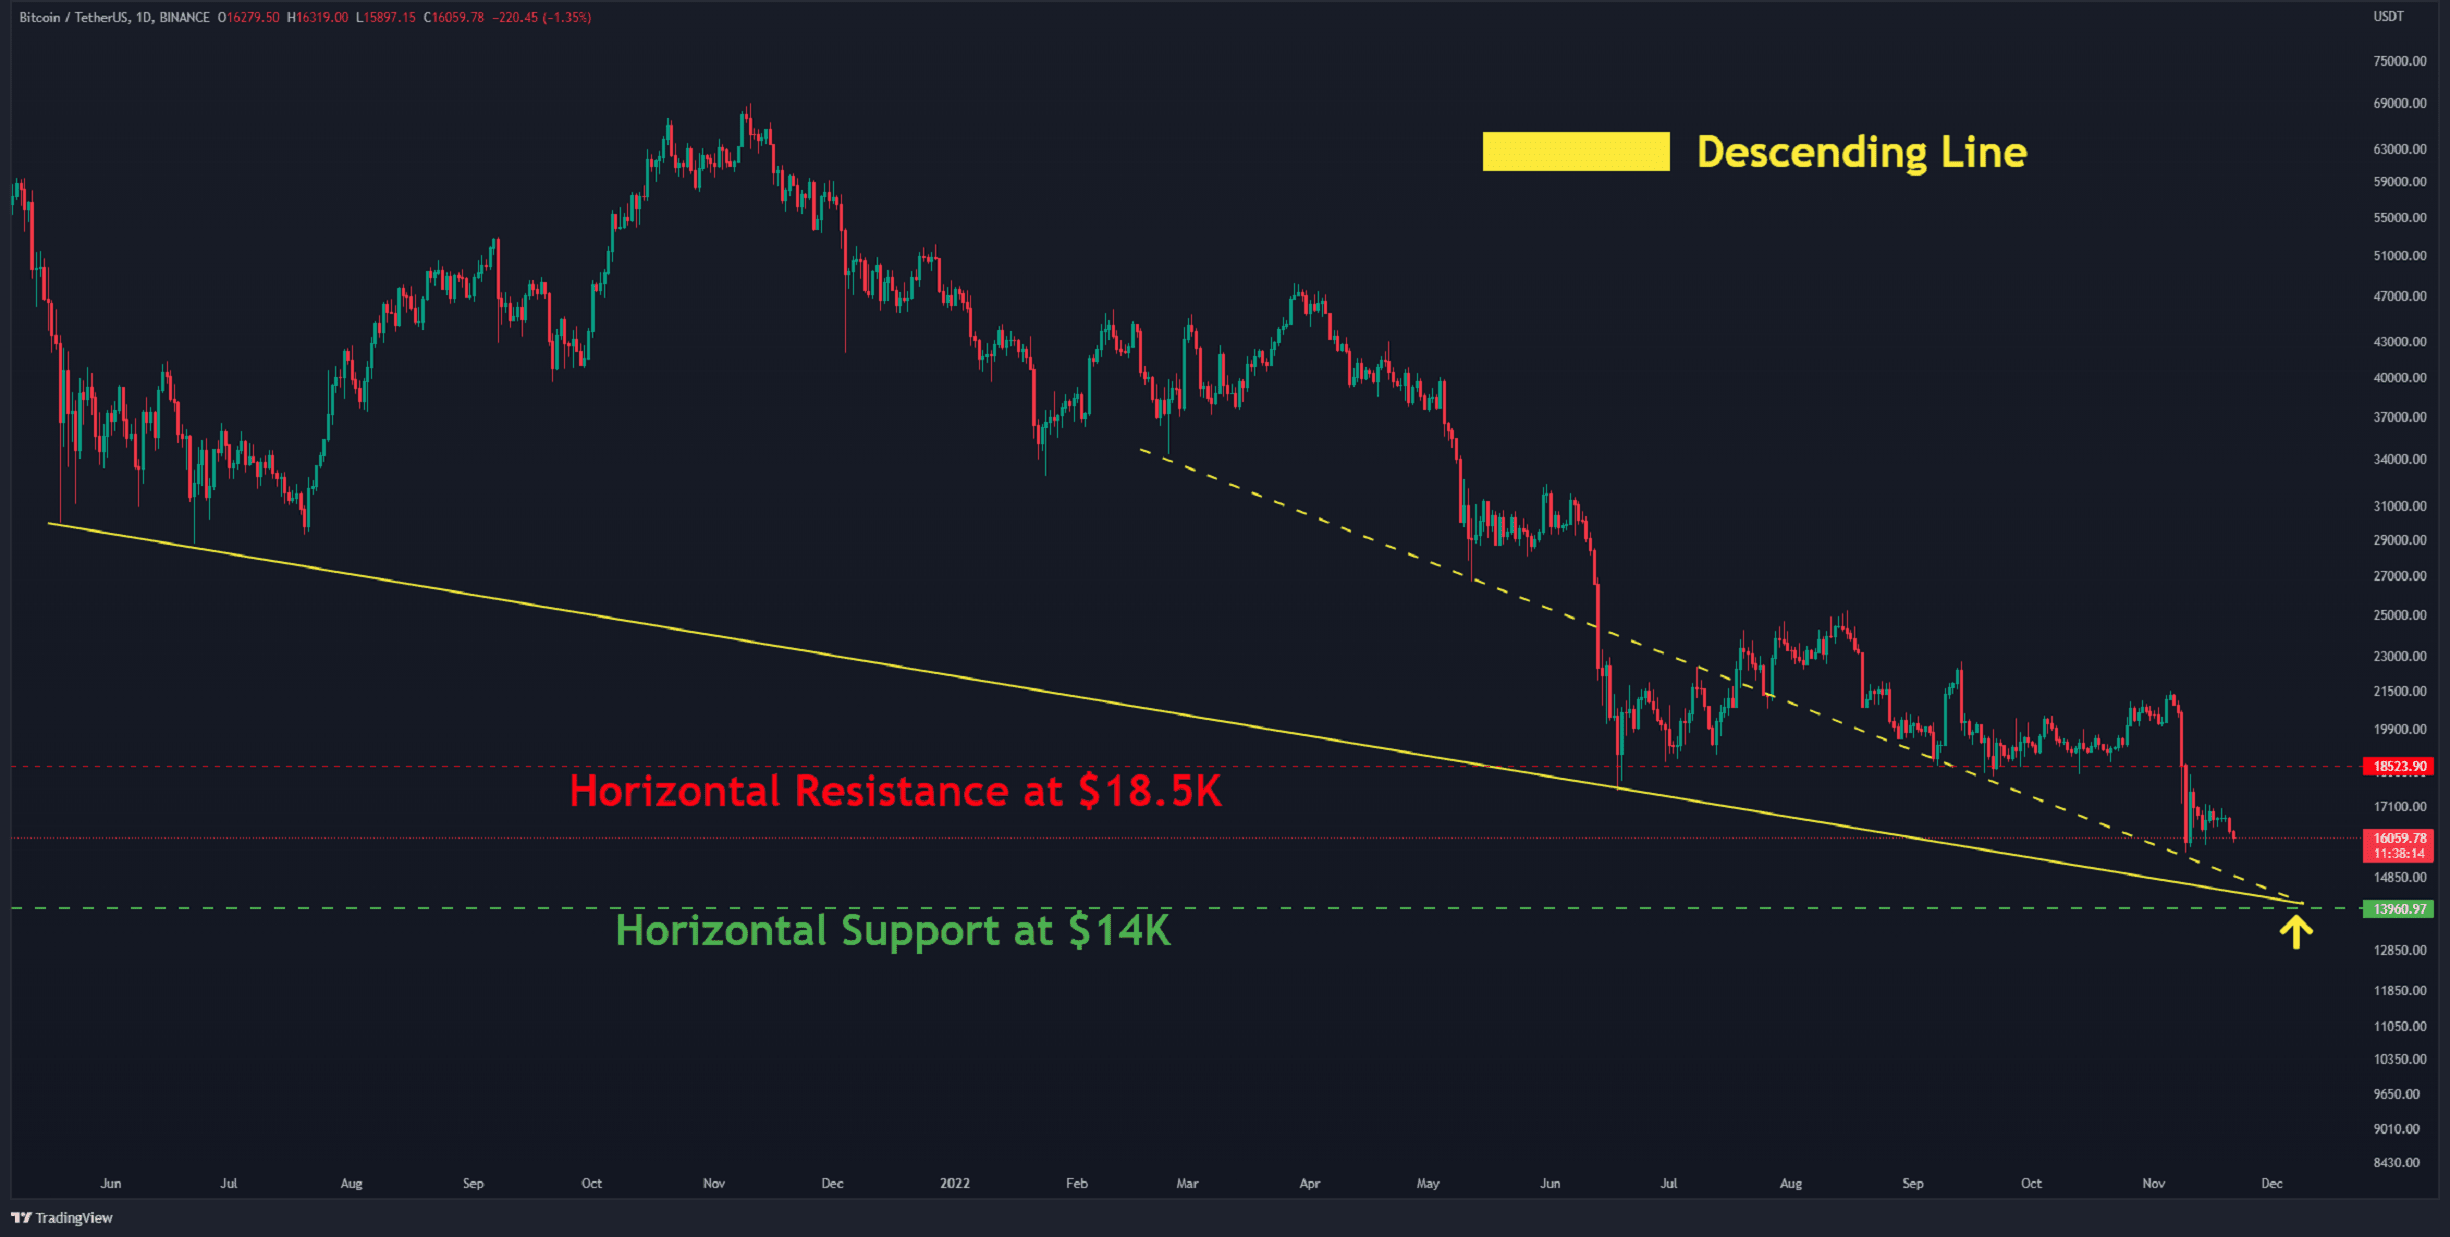
The Daily Chart:
On the daily chart, there are still no credible positive signs, and the cryptocurrency appears to be trending lower. Since the current market is shrouded in fear and uncertainty, a further decline is not out of the cards.
If Bitcoin continues to fall, the strongest support level is sitting at $14K, which is the intersection of the two descending lines (in yellow) and the horizontal support level (in green).
However, If the asset rises beyond $18.5K, the negative scenario would be invalidated. If that happens, Bitcoin could be set to begin a short-term rally.
Key Support Levels: $15.5K & $14K
Key Resistance Levels: $18.5K & $20.4K
Daily Moving Averages:
MA20: $17963
MA50: $19008
MA100: $19707
MA200: $22332
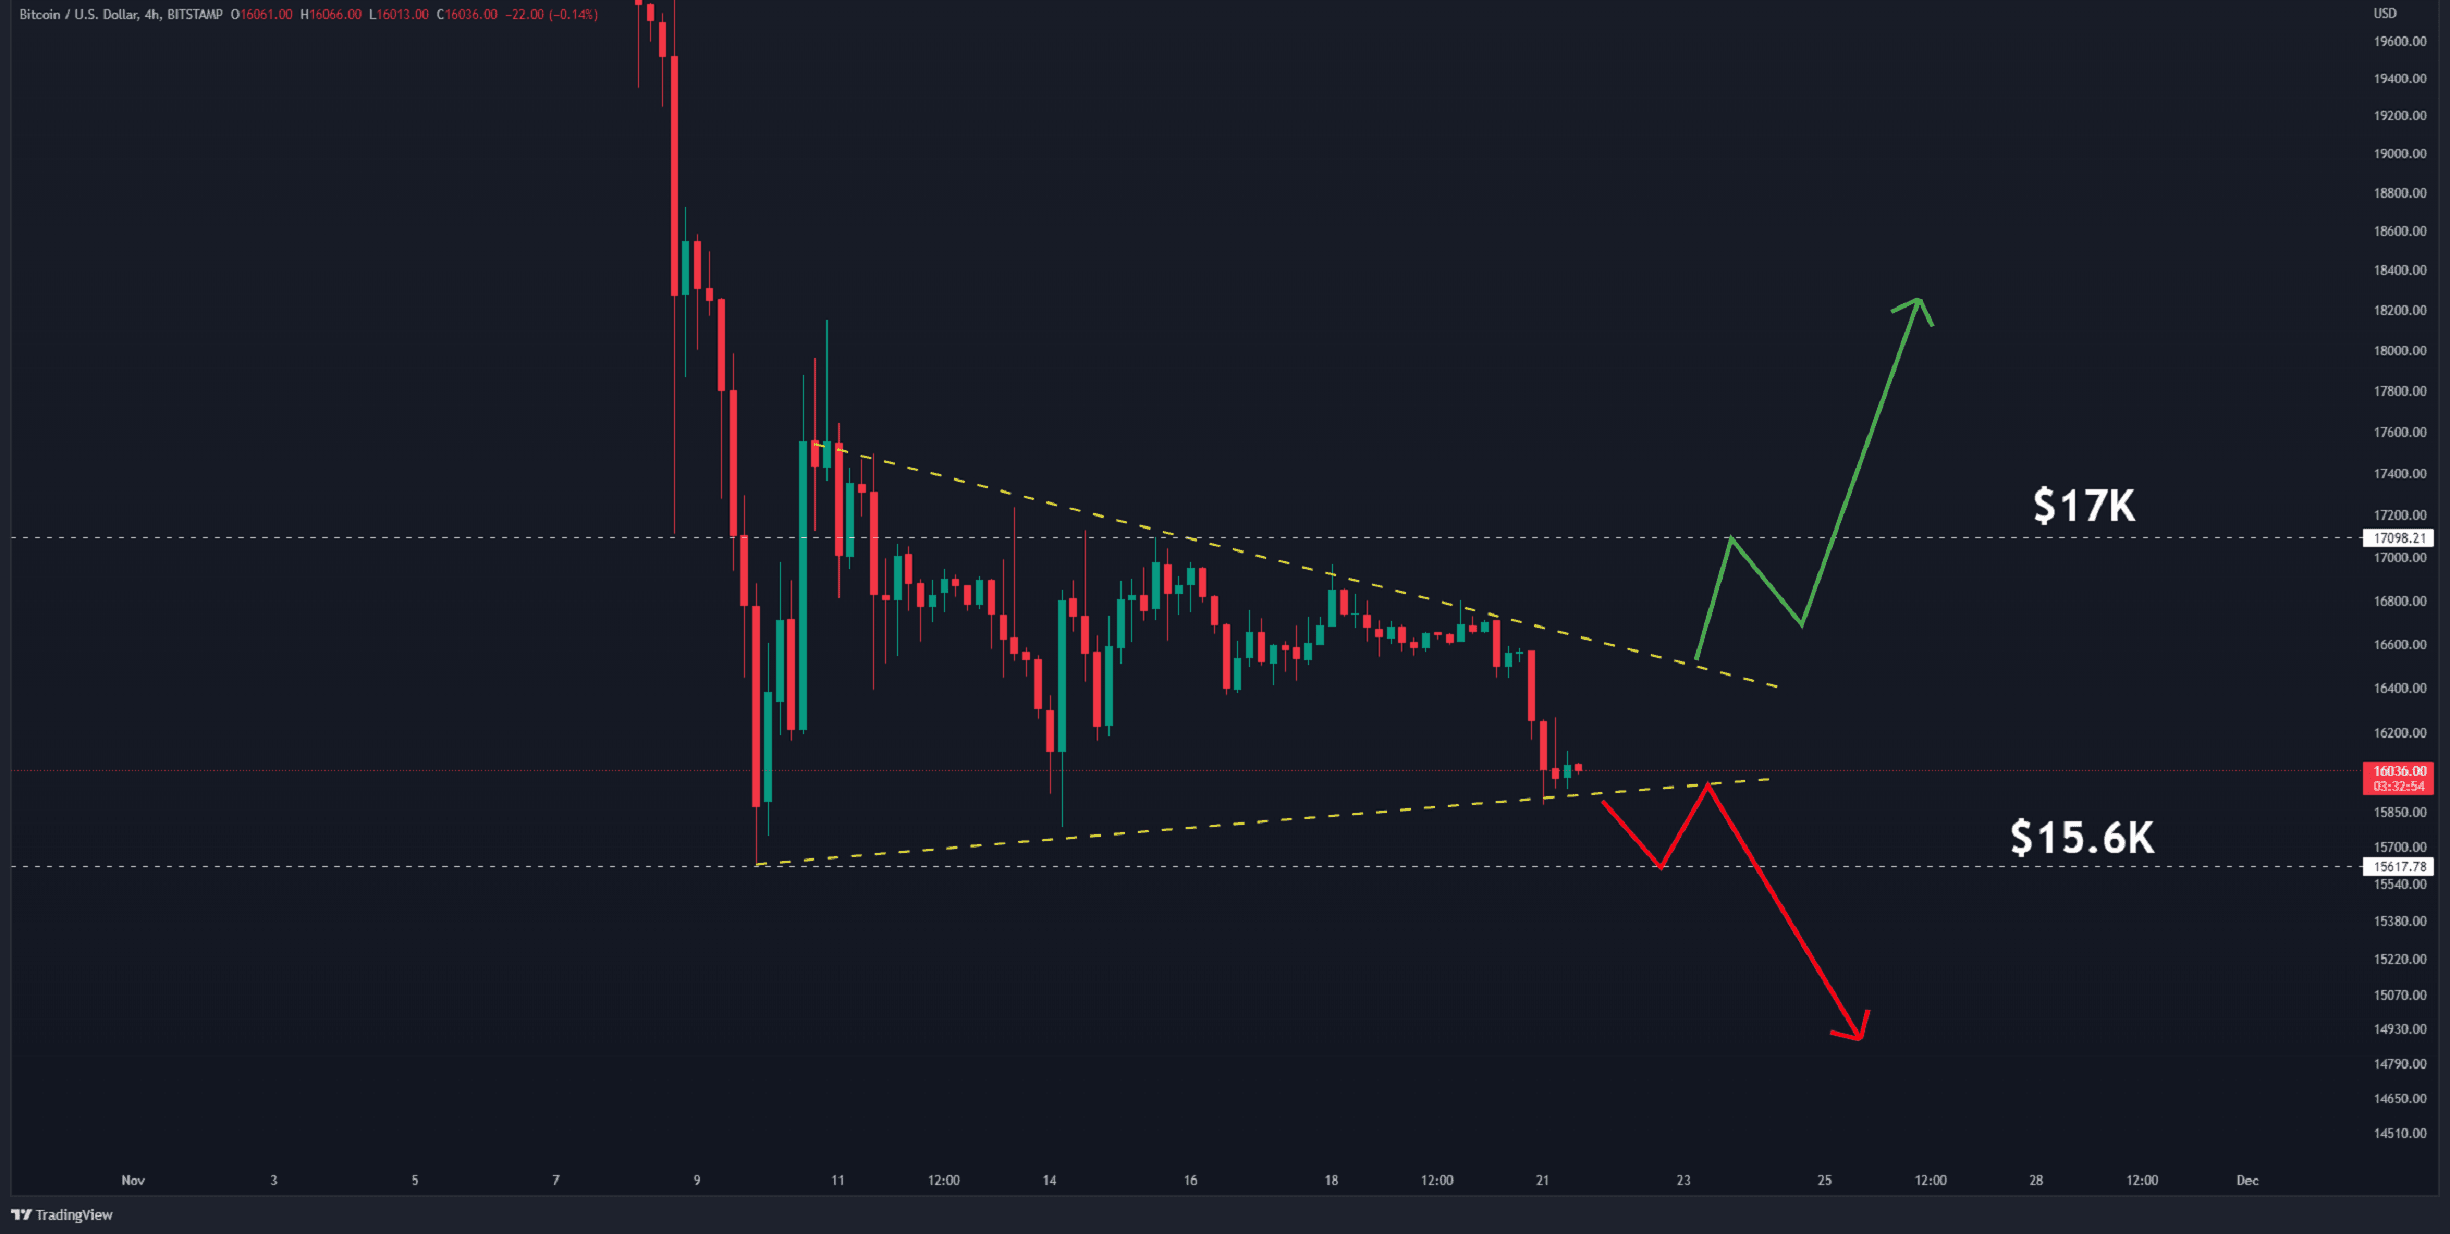
The 4-Hour Chart:
This week, the price has been fluctuating in a triangle (in yellow) on the lower timeframe. The two critical levels here are $17K and $15.6K. As demonstrated by the red and green hues, a break from any side followed by a small pullback can define the trend’s direction.
Technically, this pattern is frequently interpreted as a continuation. As a result, because the trend is downward, technical analysts anticipate the negative trend will continue. However, present volatility is driven more by the news. Therefore, it is preferable to pay close attention to the given horizontal levels.
On-chain Analysis
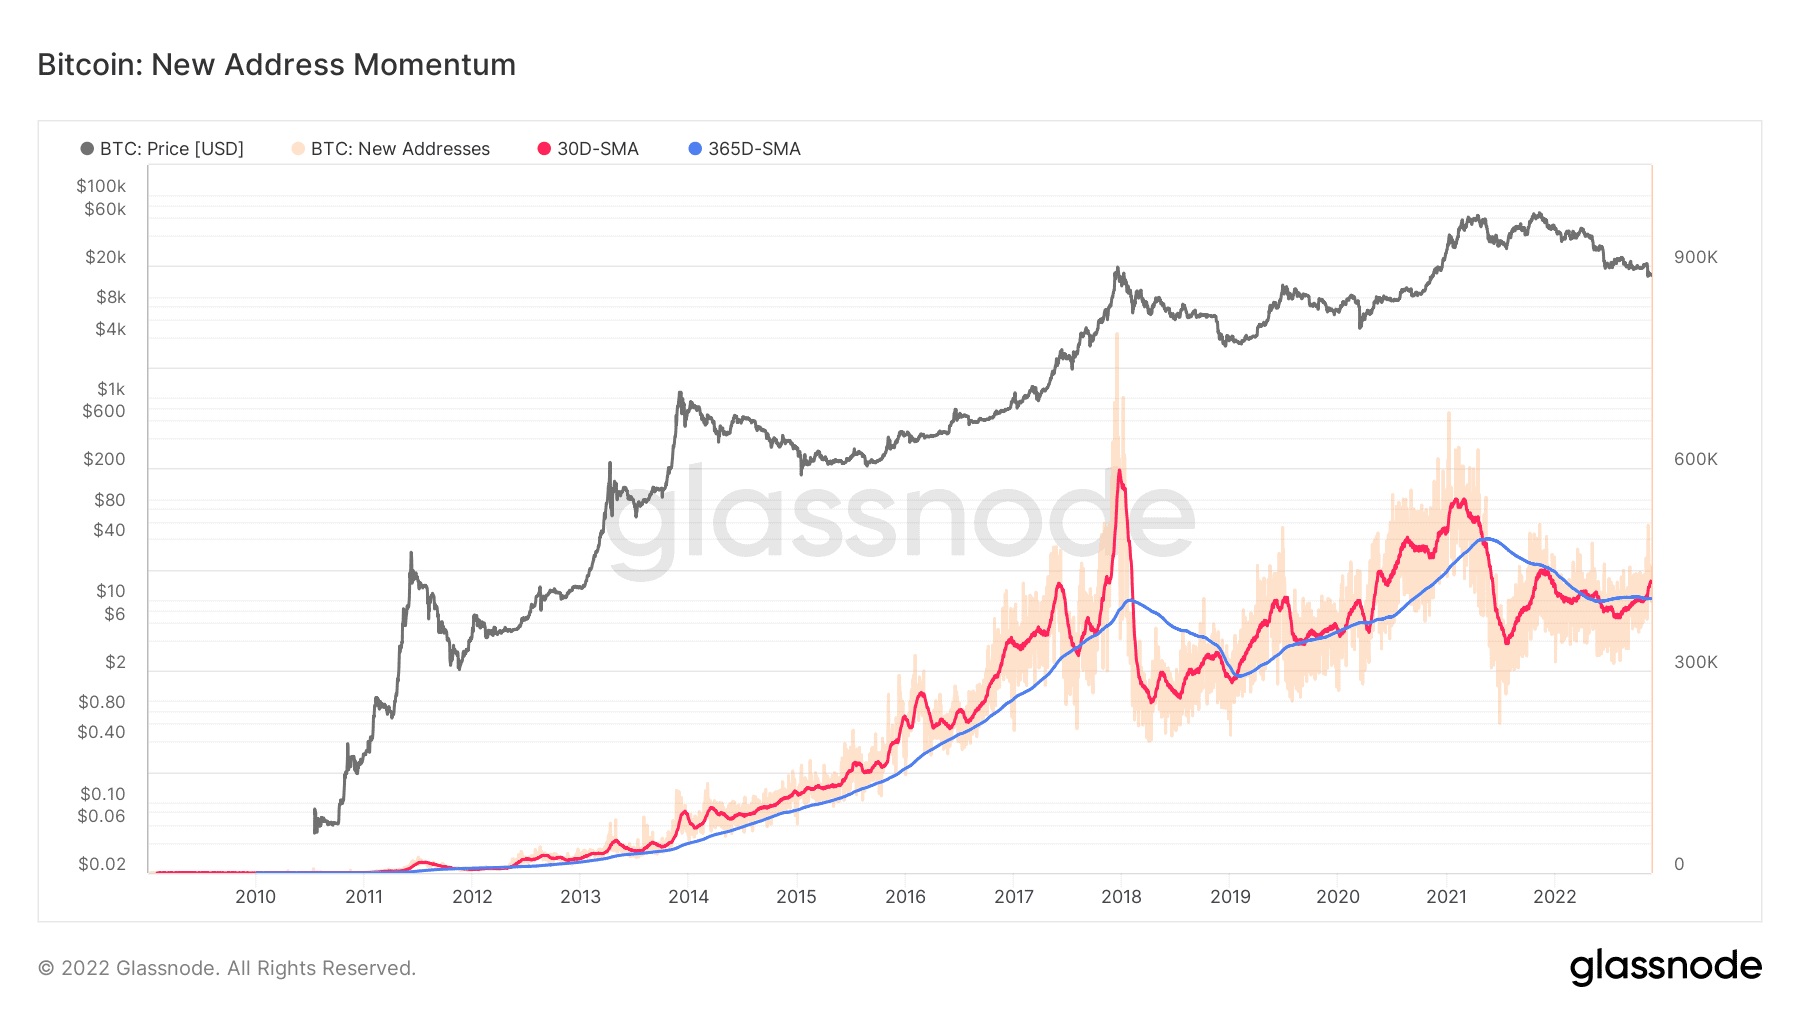
Healthy network adoption is often characterized by an uptick in daily active users, more transaction throughput, and increased demand for block space. This chart seeks to identify macro trend shifts in network adoption by comparing the Monthly Average 🔴 of New Addresses to the Yearly Average 🔵.
Currently, the monthly moving average 🔴 is slightly breaking above the yearly moving average 🔵 indicating an expansion in on-chain activity. However, typical improvement of network fundamentals and growing network utilization requires this momentum to keep rising for over 2 months.
Therefore, we should observe this metric before fully confirming the demand returning to the market.
Binance Free $100 (Exclusive): Use this link to register and receive $100 free and 10% off fees on Binance Futures first month (terms).
PrimeXBT Special Offer: Use this link to register & enter POTATO50 code to receive up to $7,000 on your deposits.
Disclaimer: Information found on CryptoPotato is those of writers quoted. It does not represent the opinions of CryptoPotato on whether to buy, sell, or hold any investments. You are advised to conduct your own research before making any investment decisions. Use provided information at your own risk. See Disclaimer for more information.
Cryptocurrency charts by TradingView.
Source: https://cryptopotato.com/bitcoin-trading-at-historic-support-but-is-a-plunge-below-16k-inevitable-btc-price-analysis/