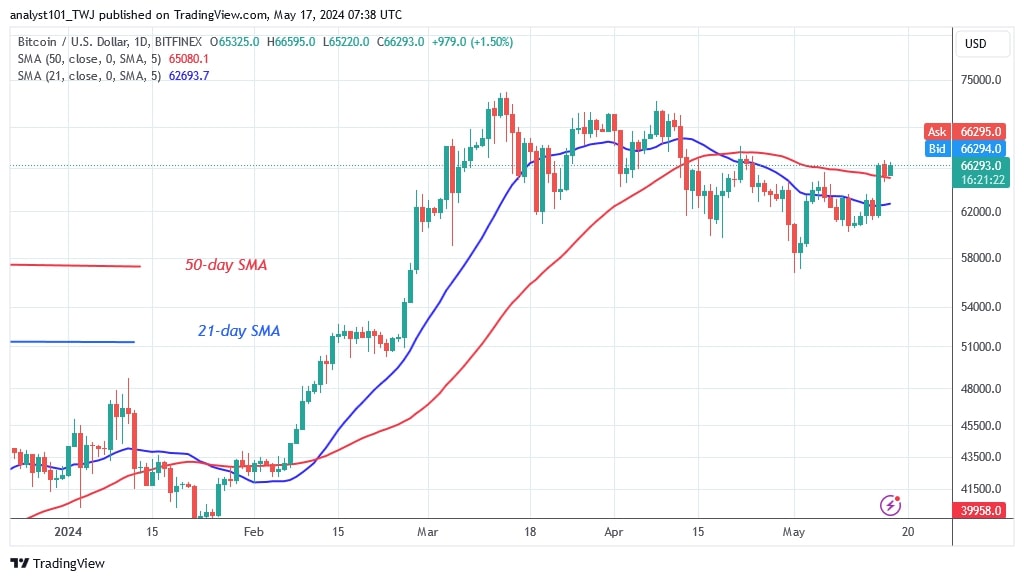
The price of Bitcoin (BTC) rose above the 21- and 50-day SMA resistance levels for the first time on May 15, 2024.
Long-term forecast for the Bitcoin price: bearish
The rally has broken the 21-day SMA and prevented the bears from defending it. Bitcoin bulls have made two unsuccessful attempts to break above the 21-day SMA resistance. On May 15, Bitcoin rose to a high of $66,500 before retreating and retesting the 50-day SMA support.
The largest cryptocurrency is on the verge of rising again after a successful test of the 50-day SMA.
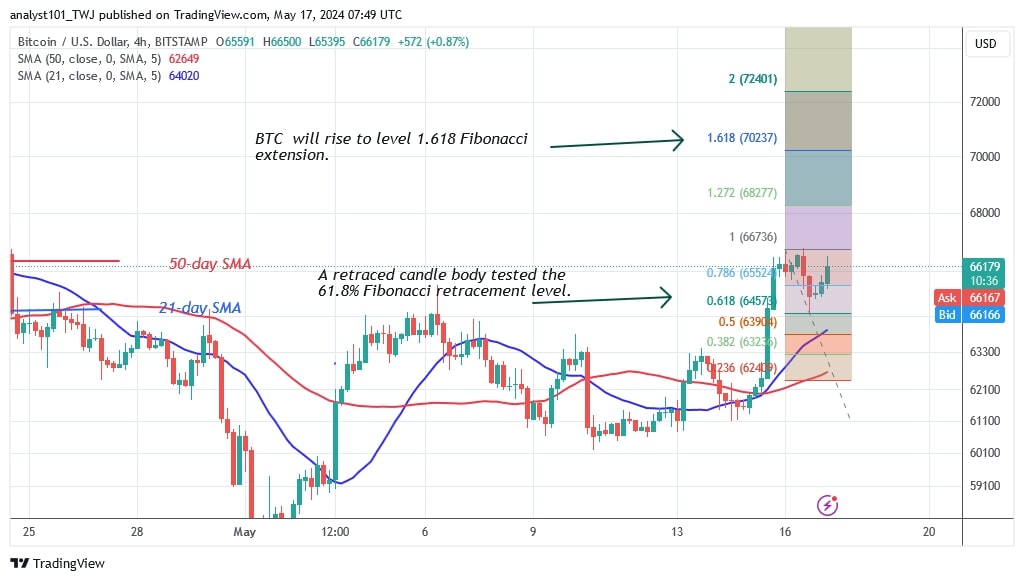
On the upside, Bitcoin will try to reclaim the psychological price of $70,000. However, the bullish momentum will encounter early resistance near the high of $68,158. Bitcoin will reach a high of $70,237 after breaking through the initial barrier of $68,158. However, Bitcoin could fall if the bears break below the 50-day SMA support. The current exchange rate between Bitcoin and the US dollar is $66,517.
Bitcoin price indicators reading
Bitcoin has recovered after breaking above the moving average lines. The cryptocurrency value will gain as long as the price bars are above the moving average lines. The bullish advance will encounter early resistance near the high of $68,000. The moving average lines are sloping horizontally, indicating a sideways trend. The 4-hour chart of Bitcoin shows a bullish crossover as the 21-day SMA crosses above the 50-day SMA.
Technical indicators:
Key resistance levels – $70,000 and $80,000
Key support levels – $50,000 and $40,000

What is the next direction for BTC/USD?
Bitcoin’s uptrend has returned and the cryptocurrency has rallied above its moving average lines. On May 16, the market rally culminated in a candlestick retracement that tested the 61.8% Fibonacci retracement line. The retracement shows that Bitcoin is capable of continuing its upward trend. According to the price indicator, the BTC price will rise to the Fibonacci extension of $1.618 or to the high of $70,237.

Disclaimer. This analysis and forecast are the personal opinions of the author and are not a recommendation to buy or sell cryptocurrency and should not be viewed as an endorsement by CoinIdol.com. Readers should do their research before investing in funds.
Source: https://coinidol.com/bitcoin-prepares-to-head/
