Bitcoin price analysis shows no signs of improvement over the past 24 hour price action, as price dipped further to continue decline set on October 30. BTC lowered to $20,086, before forming some upward momentum to reach up to $20,200 at the time of writing. However, market for Bitcoin has fallen weak with the US Central Bank’s decision to raise interest rates till the current inflation shows signs of improving. The weakened USD status has left BTC to withdraw from its last week high of $20,802 to find support just above $20,000. To change market sentiment, the October resistance of $21,078 will need to be breached by BTC bulls.
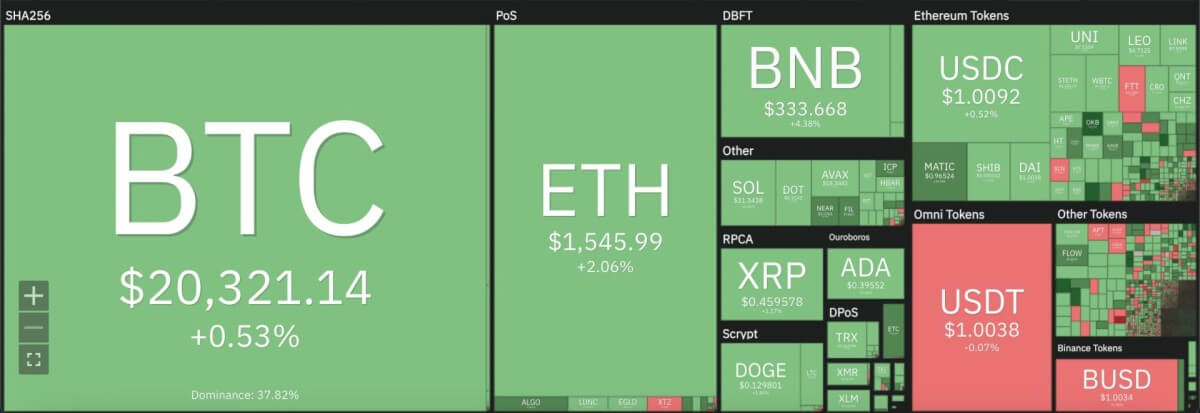
The larger cryptocurrency market consolidated mainly around yesterday’s prices, with Ethereum rising by 2 percent to reach up to $1,500. Meanwhile, leading Altcoins recorded similar minor increments. BNB rose 4 percent to sit at $333.82, whereas Ripple remained in touching distance of the $0.46 mark. Dogecoin recorded a 2 percent rise to move up to $0.13, and Cardano rose 3 percent to settle at $0.39. Solana and Polkadot recorded a 3 percent rise each, to move up to $31.38 and $6.51, respectively.

Bitcoin price analysis: BTC dips just below crucial moving averages on daily chart
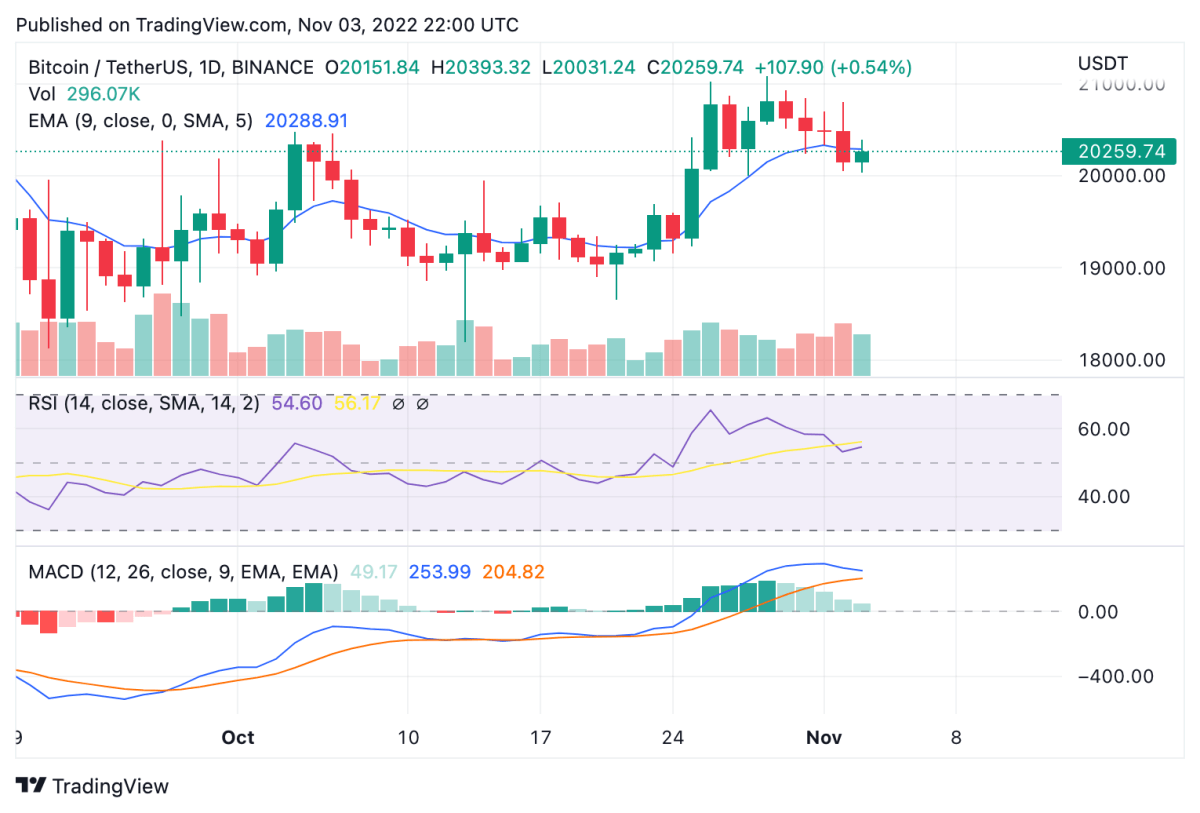
On the 24-hour candlestick chart for Bitcoin price analysis, price can be seen forming a descending triangle pattern since October 30, which as broken the upward trend above the $21,000 mark for BTC to settle around the $20,000 mark. While the bottom support still sits around $18,000, BTC price has already fallen below crucial moving averages, including the 9 and 21-day moving averages, and the 50-day exponential moving average (EMA) at $20,306.

The October-high of $21,078 holds as a resistance at the current trend, with technical and psychological momentum of the market lying in that range, whereas support has formed at $20,000. A clear break above the resistance point could be necessary for bulls to gain momentum and the 24-hour relative strength index (RSI) value, currently at 54.60 could be retested. Meanwhile, the moving average convergence divergence (MACD) curve also shows a bearish divergence in place with September 2022 low of $18,157 well in place if price falls below $20,000.
Disclaimer. The information provided is not trading advice. Cryptopolitan.com holds no liability for any investments made based on the information provided on this page. We strongly recommend independent research and/or consultation with a qualified professional before making any investment decisions.
Source: https://www.cryptopolitan.com/bitcoin-price-analysis-2022-11-03/
