Bitcoin Analysis
Bitcoin’s price painted a red daily candle on Sunday and it was its lowest daily candle close since December 27th, 2020. BTC’s price concluded its daily session on Sunday -$1,755.
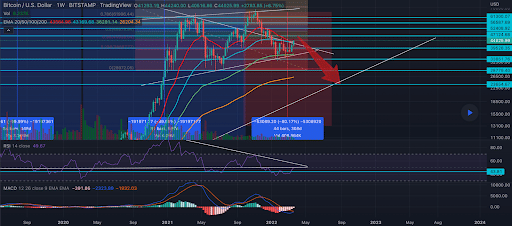
The first chart we’re analyzing today is the BTC/USD 1W chart below from omarzsns. BTC’s price is trading below 0 [$28,972.05] and a full retracement, at the time of writing.
Bitcoin still leads the majority of the price action across the macro crypto market and thus the momentum driven asset class is on full display currently to the downside of the charts.
Bullish traders are still looking to reverse course but have their work cut out for them. Overhead targets to the upside are 0.382, 0.5 [$49,979.94], and 0.618 [$56,443.57].
Conversely, bearish traders are in total control and have their sights set on the $20k level again which eight months ago would have been unthinkable by the majority of bitcoin market participants.
The Fear and Greed Index is 11 Extreme Fear and is -3 from Sunday’s reading of 14 Extreme Fear.

Bitcoin’s Moving Averages: 5-Day [$30,471.10], 20-Day [$30,003.82], 50-Day [$35,199.01], 100-Day [$38,141.85], 200-Day [$45,040.74], Year to Date [$38,725.13].
BTC’s 24 hour price range is $26,772-$28,551 and its 7 day price range is $26,722-$28,558. Bitcoin’s 52 week price range is $26,600-$69,044.
The price of bitcoin on this date last year was $39,004.
The average price of BTC for the last 30 days is $29,809 its -5.5% over the same duration.
Bitcoin’s price [-6.17%] closed its daily candle worth $26,670 and in red figures for the sixth straight day on Sunday.
Ethereum Analysis
Ether’s price also traded lower over the weekend and ETH made its lowest daily candle close since March 2nd, 2021 on Saturday. ETH also painted its 10th consecutive red candle on the weekly time frame.
ETH’s price continued the bearish price action during Sunday’s daily session and ETH wrapped up the week’s final daily candle -$96.1.
The second chart we’re looking at today is the ETH/USD 1M chart below by TruePrimeOne. Ether’s price is trading between the 1 fibonacci level [$1,435.13] and 1.618 [$2,259.67], at the time of writing.
Traders can see ETH’s price may potentially be setting up for a history repeating cycle conclusion that leads to a 90% or more retracement as it’s done in the past.
To avoid that outcome bullish Ether traders need to flip the 1.618 back to support. Above that level the next two targets are 2.618 [$3,593.86] and 3.618 [$4,928.06].
For bearish traders to keep up their momentum and progress towards a full retracement they need to push ETH’s price below the 1 fib level next followed by 0.786 [$1,149.61], and 0.618 [$925.47].

Ether’s Moving Averages: 5-Day [$1,795.13], 20-Day [$1,888.35], 50-Day [$2,476.18], 100-Day [$2,661.35], 200-Day [$3,236.63], Year to Date [$2,741.79].
ETH’s 24 hour price range is $1,433-$1,541 and its 7 day price range is $1,423-$1,547. Ether’s 52 week price range is $1,878.66.
The price of ETH on this date in 2021 was $2,507.86.
The average price of ETH for the last 30 days is $1,878.66 and its -28.73% over the same timespan.
Ether’s price [-6.28%] closed its daily candle on Sunday worth $1,435.29 and ETH’s also closed in red figures for six consecutive days.
Solana Analysis
Solana’s price lost nearly 10% of its value on Sunday and SOL’s price wrapped-up its daily session on Sunday -$3.23.
Today’s third project of emphasis is Solana and we’re looking lastly today at the SOL/USD 1D chart below from maikisch. Solana’s price is trading between 1.382 [$28.48] and 1.236 [$33.78], at the time of writing.
Solana market participants that are still bullish want to see Solana back above the 1.236 fib level followed by 1 [$4.53], and 0.786 [$57.20].
From the perspective of bearish Solana market participants, they’re aiming to break the 1.382 to the downside with a secondary target of 1.5 [$24.80]. The third target for bears of Solana is 1.618 [$21.60].

Solana’s Moving Averages: 5-Day [$39.88], 20-Day [$45.49], 50-Day [$74.86], 100-Day [$85.98], 200-Day [$132.01], Year to Date [$93.63].
Solana’s 24 hour price range is $30.57-$34.62 and its 7 day price range is $30.57-$44.34. Solana’s 52 week price range is $30.57-$259.96.
Solana’s price on this date last year was $38.82.
The average price of SOL over the last 30 days is $45.02.
Solana’s price [-9.54%] closed its daily candle on Sunday worth $30.62 and in red digits for the third day in a row.
Source: https://en.cryptonomist.ch/2022/06/13/bitcoin-lowest-sunday/