Bitcoin Analysis
Bitcoin’s price has alternated between red and green candles for the last five days and when Monday’s candle was painted, BTC’s price was -$139.9.
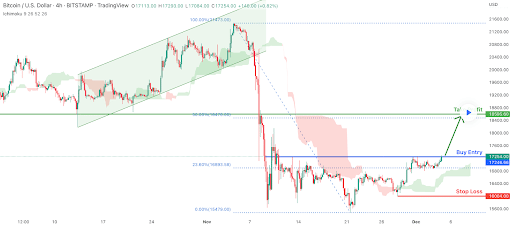
The BTC/USD 4HR chart below from desmondlzw is where we’re beginning our price analyses for this Tuesday. At the time of writing, BTC’s price is trading between the 23.60% fibonacci level [$16,893.58] and 50.00% fib level [$18,470.00].
BTC’s price has been consolidating at the 23.60% fib level since late November and bullish traders now have their sights set on the 50.00% fib level. If they can regain the 50.00% fib level their secondary target is the 100.00% fibonacci level [$21,473.00]. The chartist denotes that BTC’s price is currently bullish because its trading above The Ichimoku Cloud.
Contrarily, the bearish traders of Bitcoin’s market have targets of 23.60% and a full retracement at the 0.00% fibonacci level [$15,479.00].
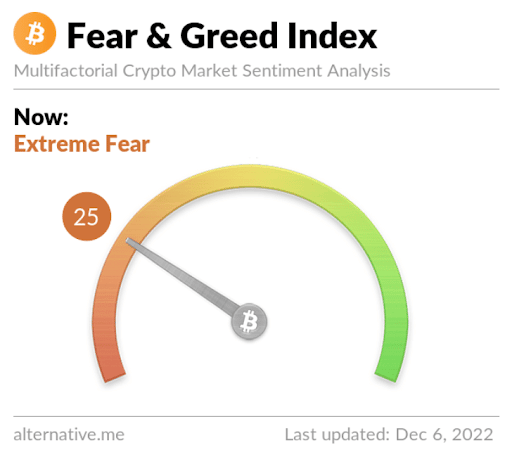
The Fear and Greed Index is 25 Extreme Fear and is -1 from Monday’s reading of 26 Fear.
Bitcoin’s Moving Averages: 5-Day [$16,943.21], 20-Day [$16,717.47], 50-Day [$18,564.92], 100-Day [$20,077.17], 200-Day [$26,611.1], Year to Date [$29,040.2].
BTC’s 24 hour price range is $16,867-$17,424.3 and its 7 day price range is $16,184.67-$17,424.3. Bitcoin’s 52 week price range is $15,501-$52,027.
The price of Bitcoin on this date last year was $50,566.6.
The average price of BTC for the last 30 days is $17,258 and its -15.6% over the same interval.
Bitcoin’s price [-0.82%] closed its daily candle worth $16,996.2 and in red figures on Monday.
Ethereum Analysis
Ether’s price also marked-down during its daily candle on Monday and concluded its trading session -$20.19.
The second chart we’re analyzing for this Tuesday is the ETH/USD 4HR chart by desmondlzw. Ether’s price is trading between the 38.20% fib level [$1,302.56] and 61.80% fib level [$1,445.55], at the time of writing.
The targets to the upside for bullish ETH market participants are the 61.80% fib level followed by the 100.00% fibonacci level [$1,677.00].
Conversely, bearish ETH traders have a primary aim to push ETH’s price below the 38.20% fib level followed by an attempt to retest the 0.00% fib level [$1,071.11].

Ether’s Moving Averages: 5-Day [$1,273.85], 20-Day [$1,222.80], 50-Day [$1,328.34], 100-Day [$1,472.04], 200-Day [$1,855.83], Year to Date [$2,044.04].
ETH’s 24 hour price range is $1,246.61-$1,305.11 and its 7 day price range is $1,167.87-$1,305.11. Ether’s 52 week price range is $883.62-$4,482.76.
The price of ETH on this date in 2021 was $4,352.66.
The average price of ETH for the last 30 days is $1,271.2 and its -16.04% over the same period.
Ether’s price [-1.58%] closed its daily candle on Monday worth $1,259.54 and also in negative figures for its daily session.
XRP Analysis
Ripple’s native token [XRP] was also sent marginally lower on Monday and when traders wrapped-up for the day, XRP’s price was -$0.00021.
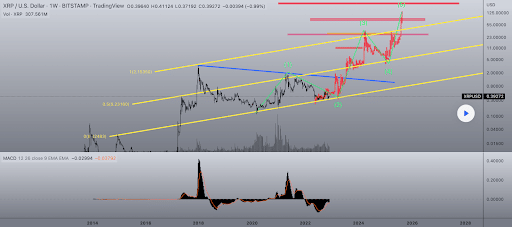
We conclude our chart analyses for this Tuesday with the XRP/USD 1W chart from mahyarkj. XRP’s price is trading between the 0 fib level [$0.02483] and 0.5 fib level [$0.23160], at the time of writing.
We can see that XRP’s price continues to respect a long-term uptrend on the weekly timescale that dates back to 2016.
The overhead targets for bullish XRP market participants are 0.5 and the 1 fib level [$2.15350].
Contrariwise, those that are still expecting further downside on the XRP market want to retest the 0 fib level and a full retrace above two cents.
Ripple’s 24 hour price range is $0.378-$0.395 and its 7 day price range is $0.378-$0.414. XRP’s 52 week price range is $0.287-$1.015.
Ripple’s price on this date last year was $0.827.
The average price of XRP over the last 30 days is $0.396 and its -14.48% for the same interval.
XRP’s price [-0.05%] closed its trading session worth $0.389 and in red figures for the fourth time in five days on Monday.
Source: https://en.cryptonomist.ch/2022/12/06/bitcoin-ethereum-ripple-xrp-price-analyses/