Bitcoin Analysis
Bitcoin’s price had its best performance of December on Tuesday and when the day’s candle was printed, BTC’s price was +$557.
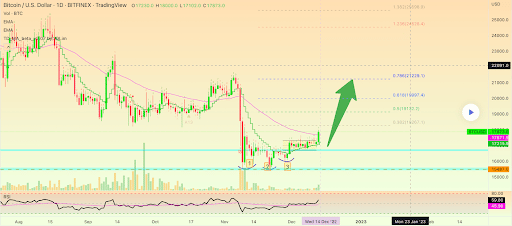
The BTC/USD 1D chart below from AlanSantana is where we’re beginning our price analyses for this Wednesday.
After weeks of relatively calm trading sessions bullish BTC market participants tried to send the asset’s price up to test the 0.382 fibonacci level [$18,267.1] on Tuesday. If they can regain the 0.382 with daily candle close confirmation this week, the bullish aim shifts to the 0.5 fib level [$19,132.2] followed by 0.618 [$19,997.4], and 0.786 [$21,229.1].
Conversely, bearish BTC traders have an aim of retesting the $16,640 level. If they can push BTC’s price below that level the next target for bearish traders of Bitcoin’s market is the asset’s multi-year low of $15,501.
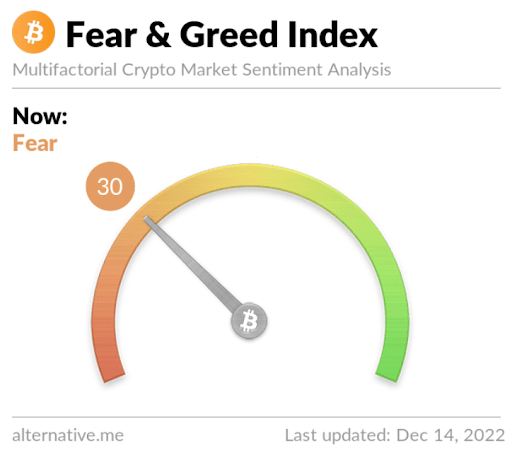
The Fear and Greed Index is 30 Fear and is +3 from Tuesday’s reading of 27 Fear.
Bitcoin’s Moving Averages: 5-Day [$17,144.61], 20-Day [$16,727.40], 50-Day [$18,264.49], 100-Day [$19,747.23], 200-Day [$25,894.85], Year to Date [$28,749.66].
BTC’s 24 hour price range is $17,102-$18,000 and its 7 day price range is $16,781.78-$18,000. Bitcoin’s 52 week price range is $15,501-$52,027.
The price of Bitcoin on this date last year was $48,408.
The average price of BTC for the last 30 days is $16,759.4 and its +2% over the same interval.
Bitcoin’s price [+3.23%] closed its daily candle worth $17,785 and in green digits for a second day in a row on Tuesday.
Ethereum Analysis
Ether’s price performed similarly to BTC on Tuesday and concluded its daily candle +$45.75.
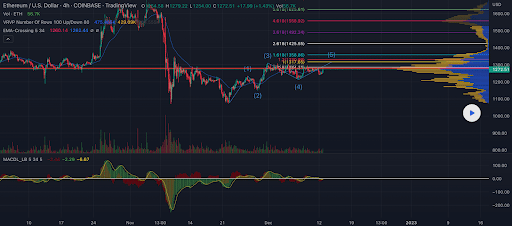
The second asset we’re looking at today is Ether and more specifically we’re looking at the ETH/USD 4HR chart below by fknbadbeats. ETH’s price is trading between the 1 fibonacci level [$1,317.65] and the 1.2 fib level [$1,330.99].
The targets to the upside on Ether are the 1.2 fib level, 1.618 [$1,358.86], 2.618 [$1,425.55], 3.618 [$1,492.24], 4.618 [$1,558.92], and the 5.618 fib level [$1,625.61].
At variance with those that are longing the Ether market are bearish traders that have targets to the downside of the 4HR chart of the 1 fibonacci level and the 0.5 fib level [$1,284.31].
Ether’s Moving Averages: 5-Day [$1,266.65], 20-Day [$1,225.65], 50-Day [$1,318.99], 100-Day [$1,456.70], 200-Day [$1,811.74], Year to Date [$2,025.00].
ETH’s 24 hour price range is $1,255.1-$1,349 and its 7 day price range is $1,225.02-$1,349. Ether’s 52 week price range is $883.62-$4,148.85.
The price of ETH on this date in 2021 was $3,860.41.
The average price of ETH for the last 30 days is $1,230.17 and its +0.62% over the same period.
Ether’s price [+3.59%] closed its daily session on Tuesday worth $1,320.73 and in green figures for the third time in four days.
Cardano Analysis
Cardano’s price also rallied more than 2% on Tuesday and finished its daily session +$0.0068.
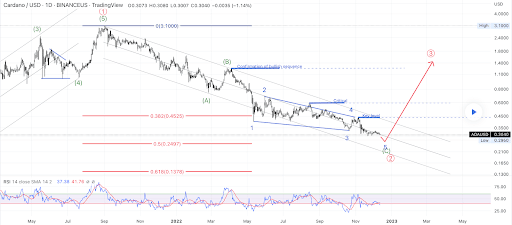
The final chart to conclude Tuesday’s price analyses is the ADA/USD 1D chart below by HerWill. ADA’s price is trading between the 0.5 fib level [$0.2497] and 0.382 fib level [$0.4525], at the time of writing.
Traders of Cardano’s market are stuck in the middle of these two fibs and have been accumulating just above the $0.30 level for more than a month.
If bullish ADA traders can clearly establish price action on the asset above the heart-line then their next target is the 0.382 fib level.
Bearish traders however are hoping to retest the bottom of a long-term descending channel and break the 0.5 fibonacci level [$0.2497] before testing the 0.618 [$0.1378].
Cardano’s 24 hour price range is $0.313-$0.315 and its 7 day price range is $0.301-$0.319. ADA’s 52 week price range is $0.296-$1.63.
Cardano’s price on this date last year was $1.26.
The average price of ADA over the last 30 days is $0.318 and its -11.72% over the same stretch.
Cardano’s price [+2.20%] closed its daily candle on Tuesday worth $0.313 and in positive digits for the first time in three days.
Source: https://en.cryptonomist.ch/2022/12/14/bitcoin-ethereum-cardano-tuesday/