Bitcoin continues to test the $18.5K support level as the bulls lack the strength necessary to move the price up. Investors have been seeking safer options amidst fears of stagflation. As a result, the DXY index has increased.
Technical Analysis
By Grizzly
The Daily Chart
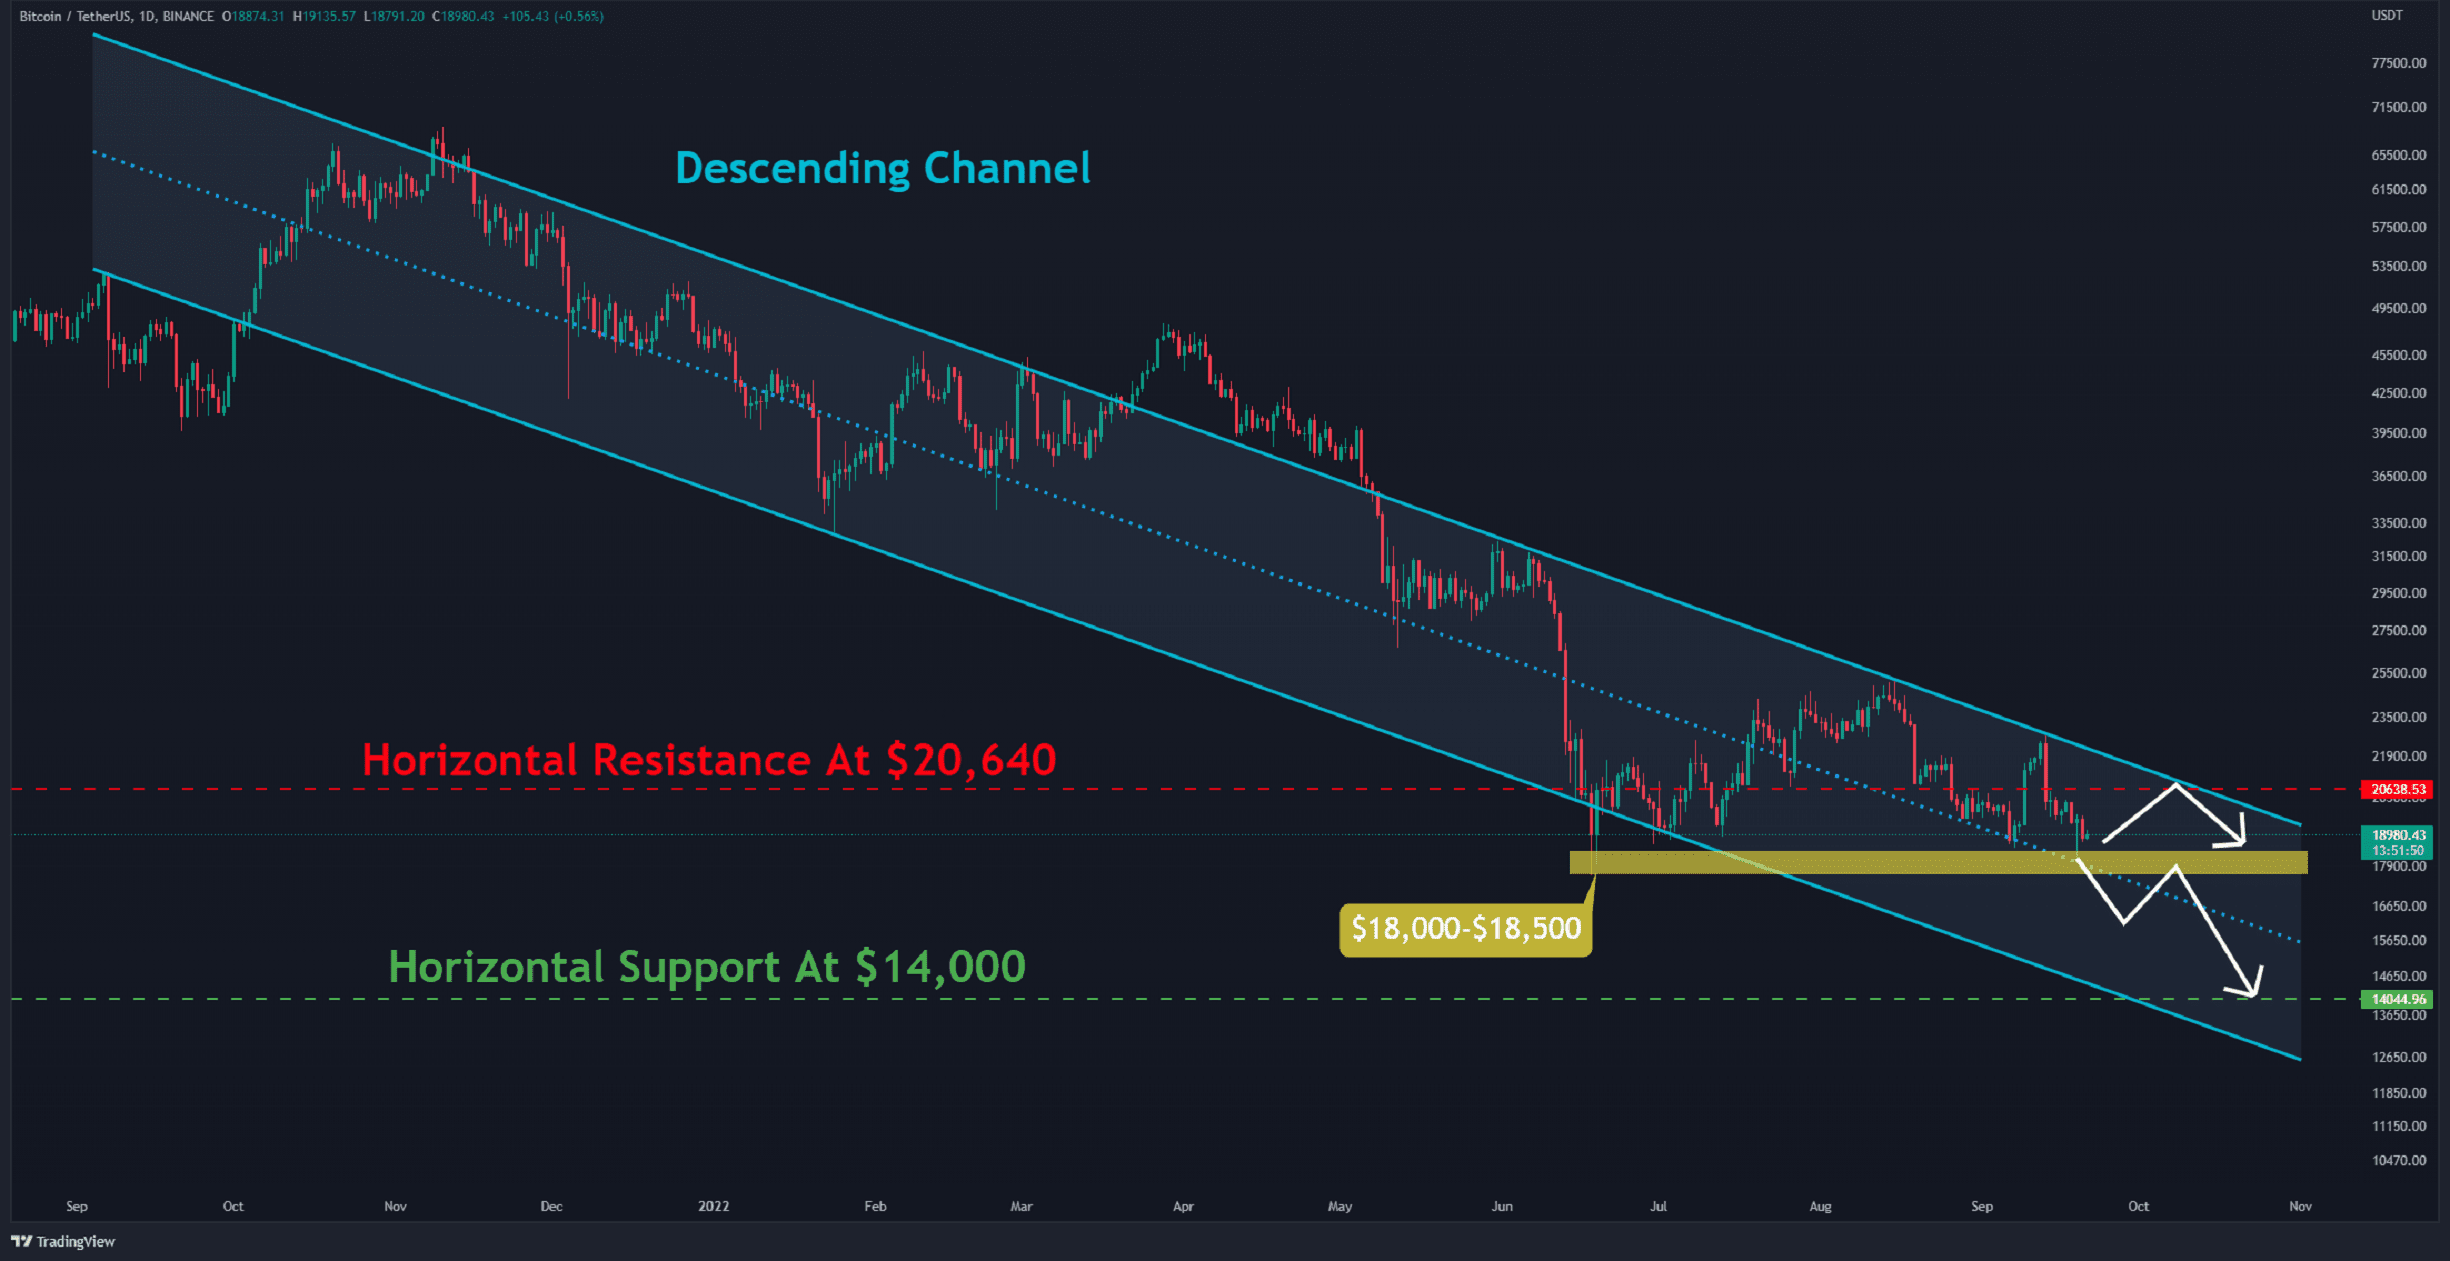
On the daily chart, the recent bullish leg has come to an end after the price hit the top of a descending channel (in light blue). Despite this, Bitcoin is currently trading above the horizontal support range of $18K – $18.5K (in yellow).
Suppose the bears are successful in bringing the price down to this level and closing there. By breaching the channel’s midline support, the asset could drop to $16K and, subsequently, even $14K in the mid-term.
However, the upcoming FOMC meeting that’s scheduled to take place later today could also propel the price towards the upside, providing the news from the Federal Reserve is positive. This scenario doesn’t look very likely.
Given that the DXY index is strongly bullish – a bad omen for the cryptocurrency market – such an increase is likely to be only temporary at this time.
Key Support Levels: $18K & $16K
Key Resistance Levels: $20.6K & $22.6K
Daily Moving Averages:
MA20: $20057
MA50: $21359
MA100: $21340
MA200: $29146
The 4-Hour Chart
A bearish structure is evident in the lower timeframe when lower lows occur. The recent bottom, at $18.3K, is nearly in line with the low before it, indicating that the negative sentiment has somewhat slowed down.
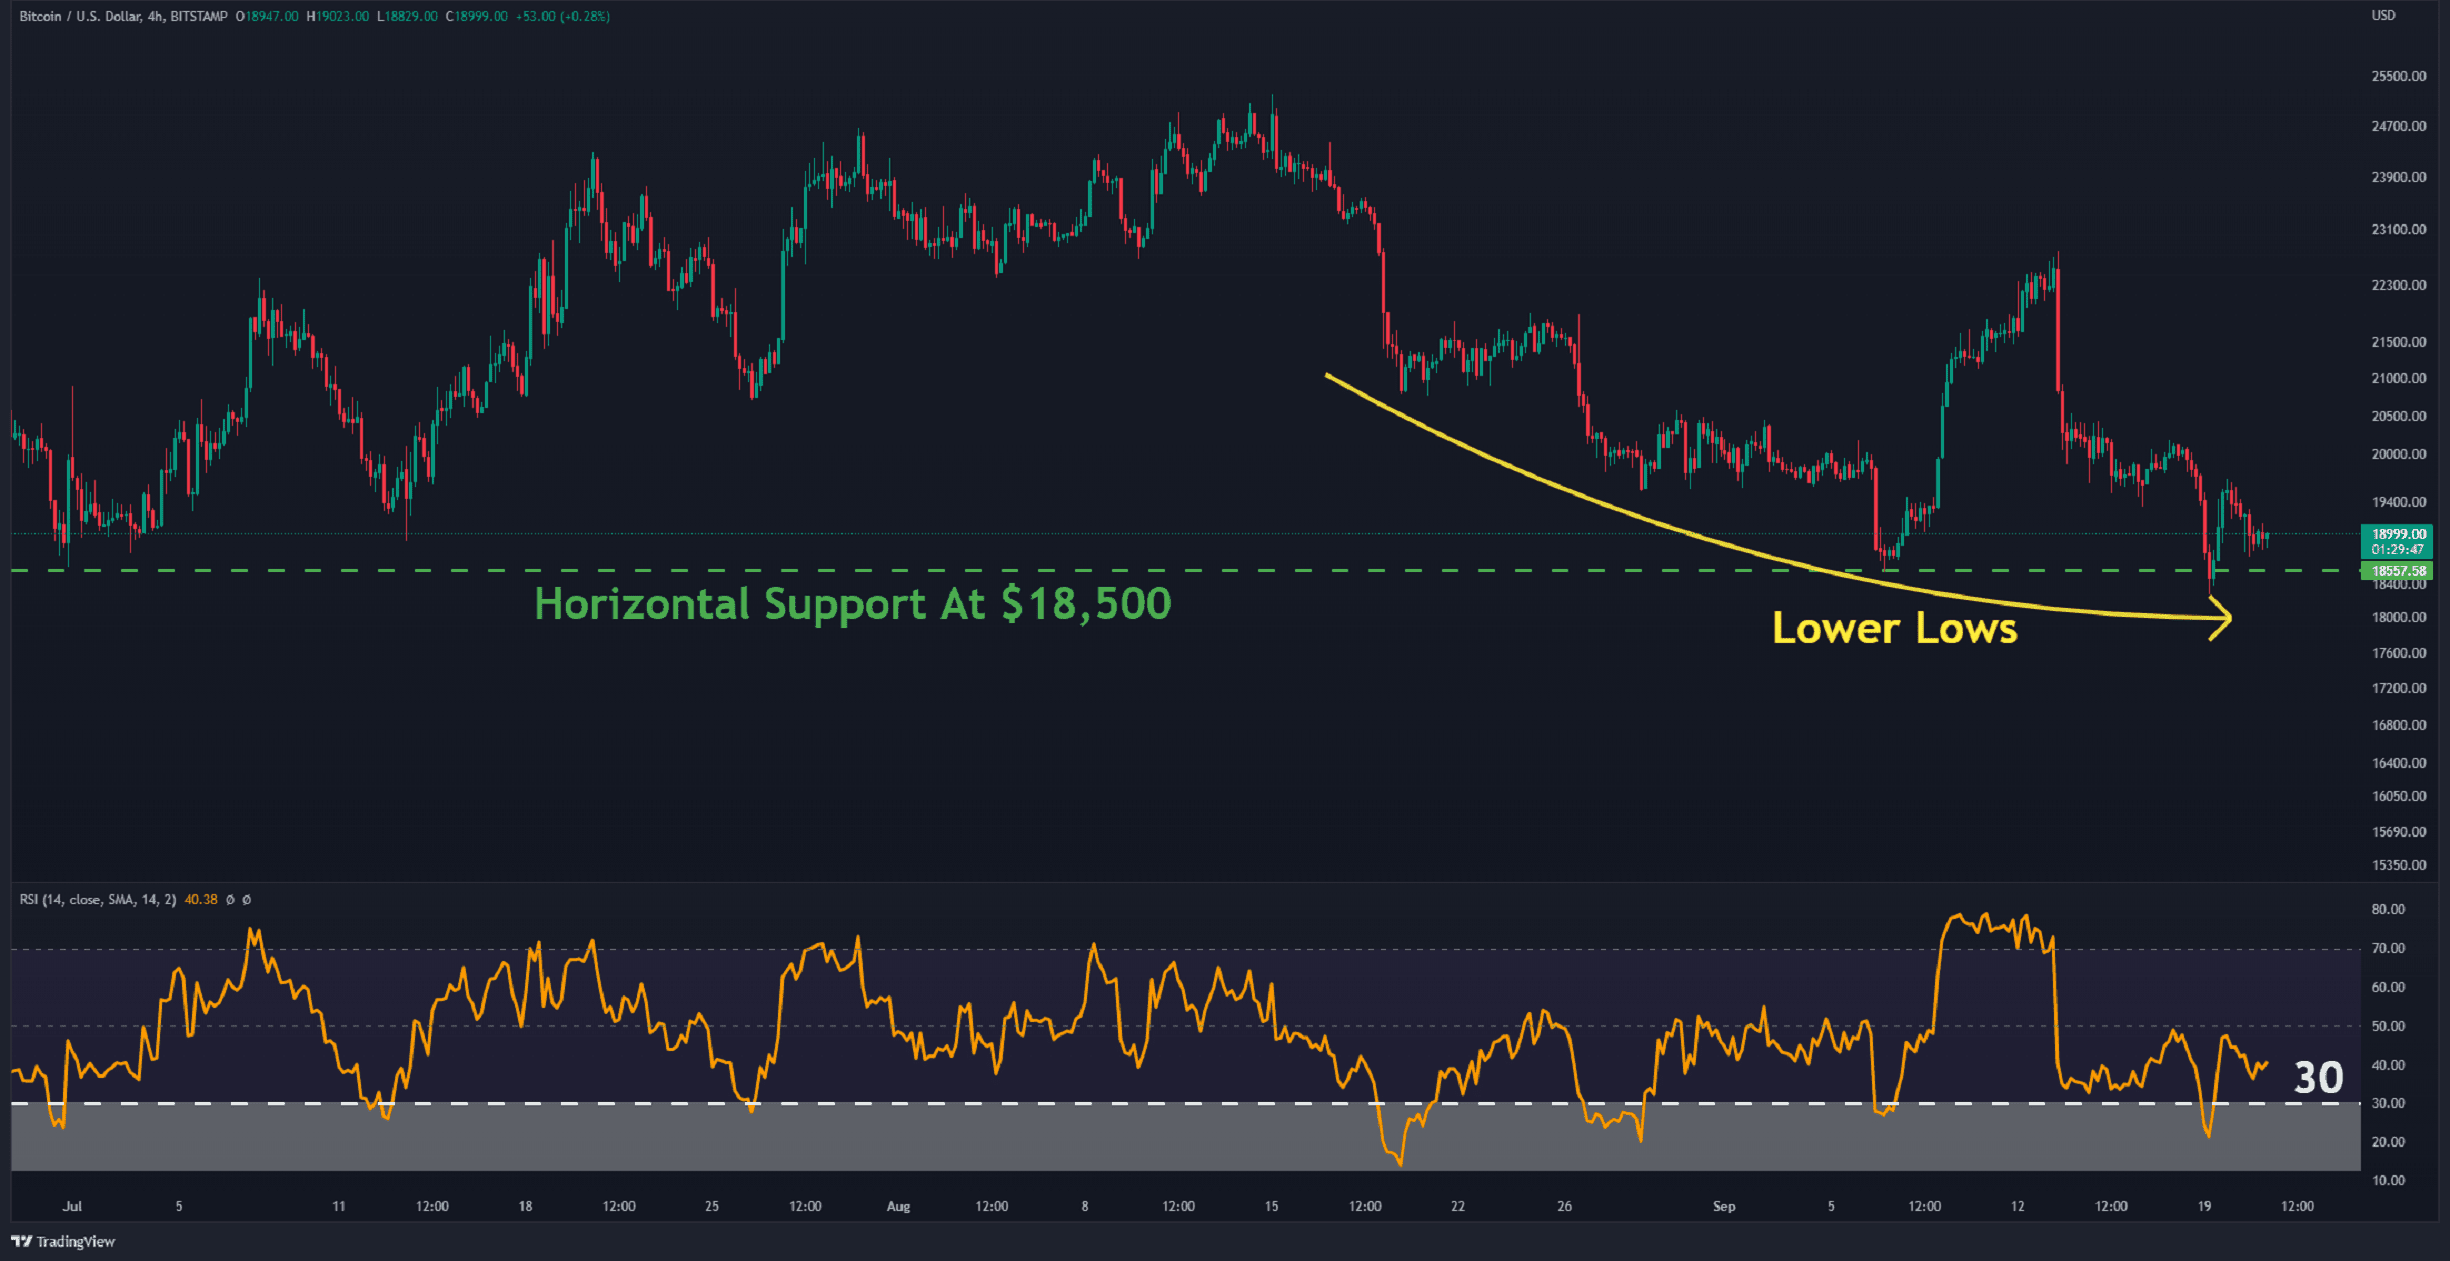
The trading pair, on the other hand, often moved consistently with the Relative Strength Index (RSI) after it first dropped below 30 and then broke over 50. It is presently below the baseline, indicating that the market is generally negative.
On-chain Analysis
By: Edris
Adjusted Spent Output Profit Ratio (aSOPR)
Bitcoin investors often realize heavy losses during bear markets, as the asset tends to crash by more than 80% in these periods. Furthermore, the bear market bottom is typically where investors lose hope about its ability to reverse. This is usually because investors lose confidence in the market’s recovery or are anticipating even further declines.
However, wealthier investors tend to enter the market at these lower prices and buy BTC when they consider it to be undervalued. At this point, the market usually begins to form a bottom as the smart money accumulates and the retail distributes.
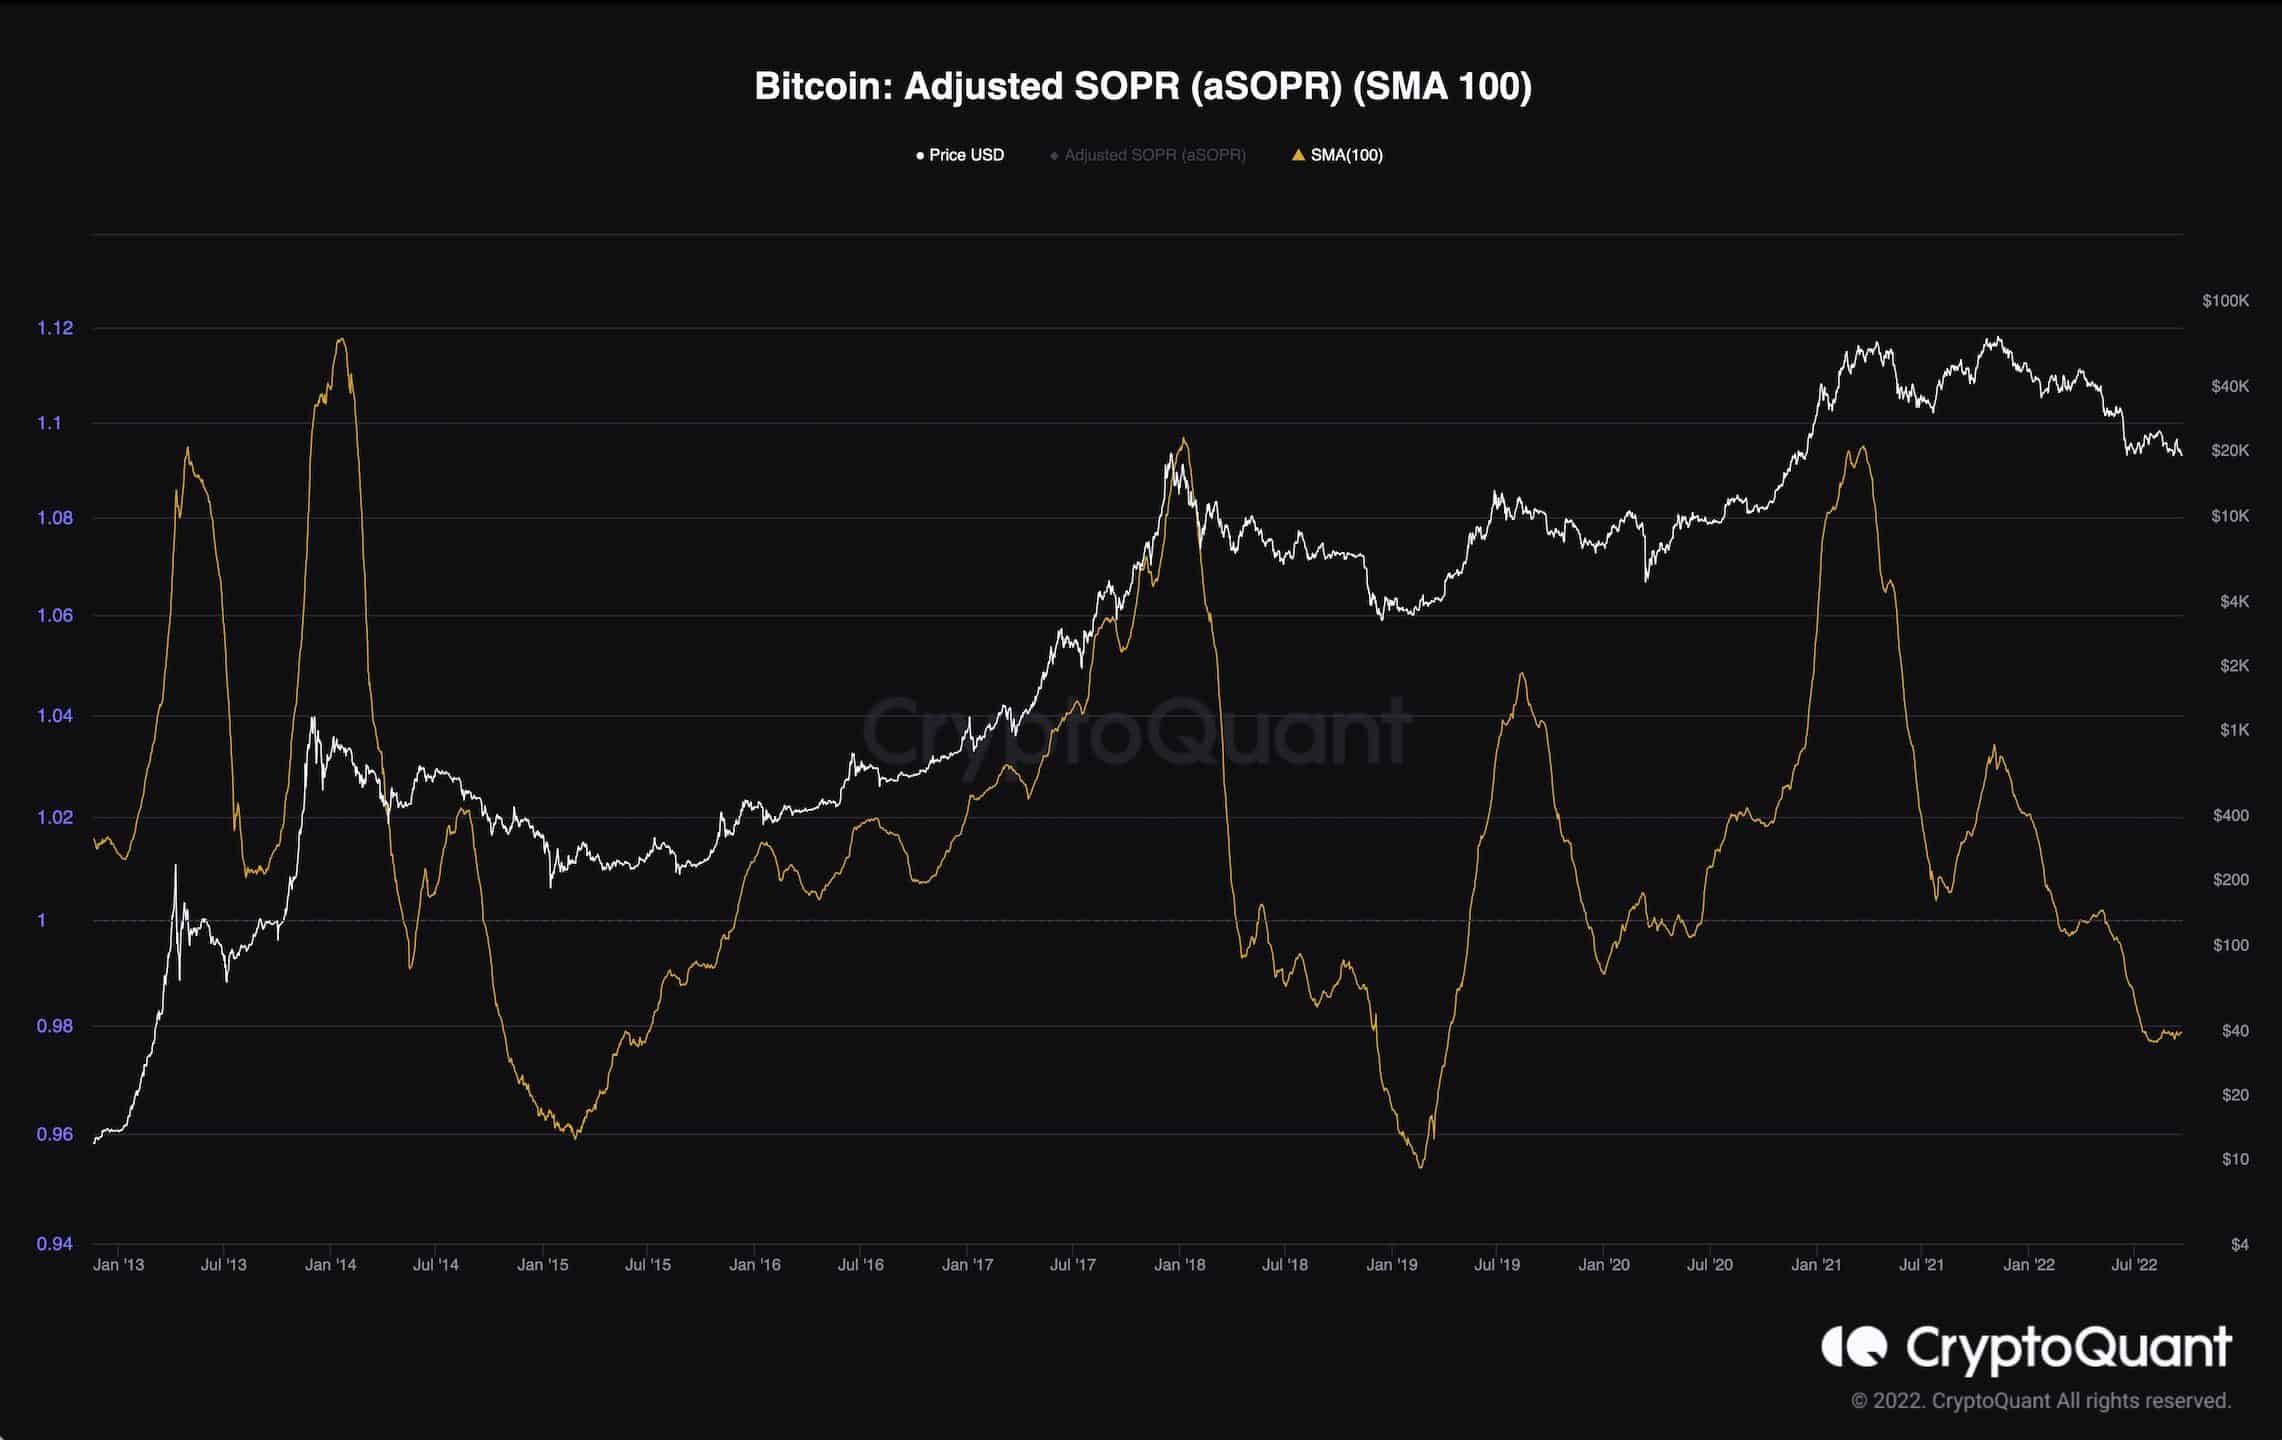
One of the most useful metrics to demonstrate the ratio of profits and losses being realized every day is the aSOPR. Values above 1 show profits, and values below 1 indicate losses being realized.
Over the last few months, the aSOPR has been below one. This means that losses are being realized on a daily basis by market participants, and smart money may be accumulating aggressively. So, the bear market bottom could be near.
However, if the current cycle is going to be anything like the previous ones, the price could head lower. It’s important to remain cautious.
Binance Free $100 (Exclusive): Use this link to register and receive $100 free and 10% off fees on Binance Futures first month (terms).
PrimeXBT Special Offer: Use this link to register & enter POTATO50 code to receive up to $7,000 on your deposits.
Disclaimer: Information found on CryptoPotato is those of writers quoted. It does not represent the opinions of CryptoPotato on whether to buy, sell, or hold any investments. You are advised to conduct your own research before making any investment decisions. Use provided information at your own risk. See Disclaimer for more information.
Cryptocurrency charts by TradingView.
Source: https://cryptopotato.com/bitcoin-consolidates-around-19k-leading-into-feds-fomc-meeting-btc-price-analysis/