Maintaining a consolidation phase for the past week, the BCH coin price ignores the market-wide selling storm. Bitcoin Cash showcases solid holders’ confidence thanks to the crucial support of the 200-day EMA and the 61.80% Fibonacci level at $180.
With a YTD growth of 96%, BCH coin price proves to be a profitable investment and beats other blue chip altcoins with this phenomenal return. However, the 42% drop from its 2023 high questions the uptrend continuation.
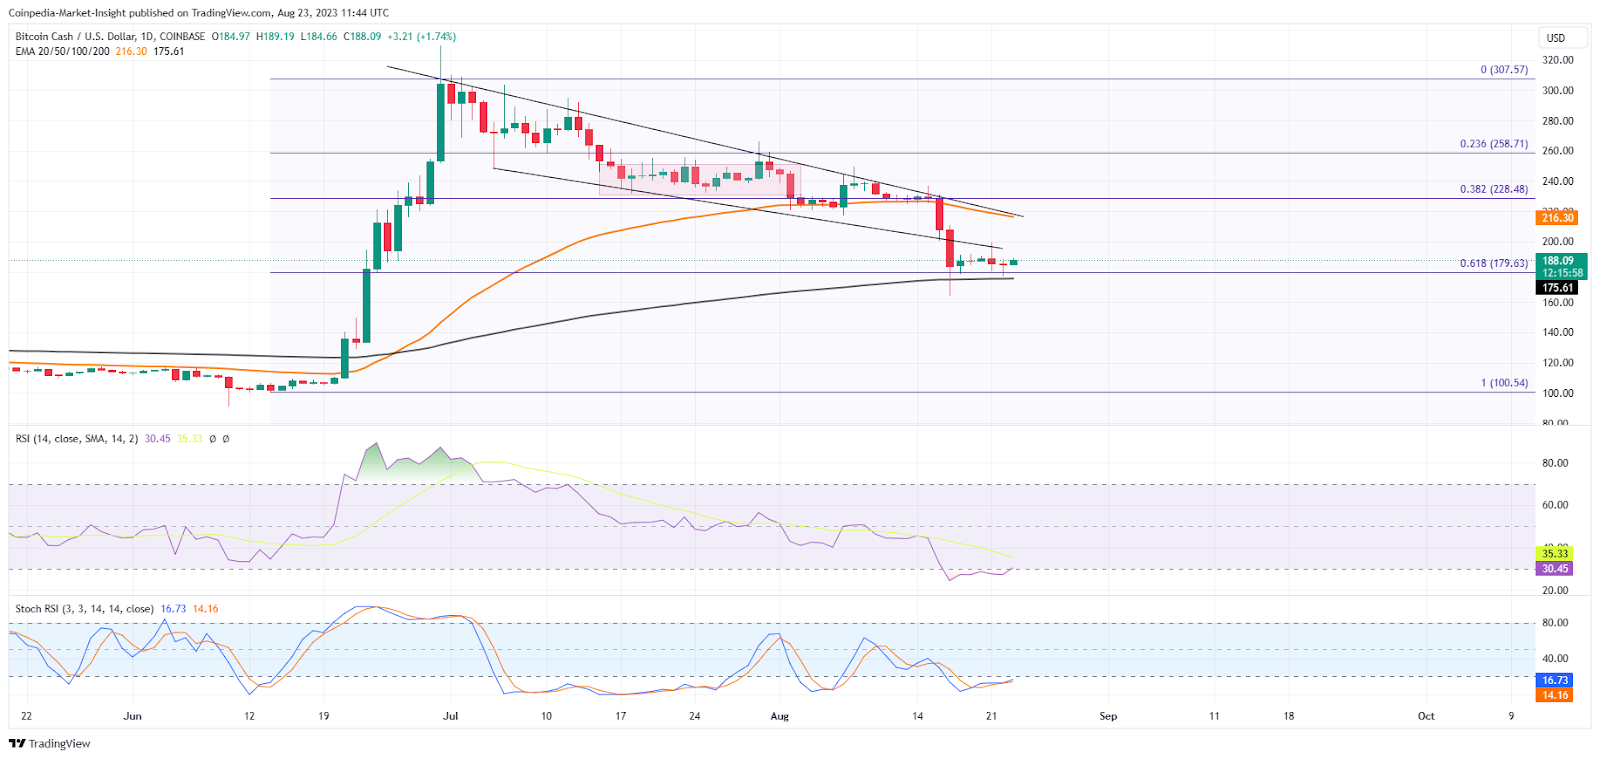
BCH coin price finds the technical indicators reflecting a potential reversal in the 1D chart. The Stochastic RSI and the daily RSI line project a recovery from the oversold zone with an uptick.
A Closer Look Into BCH Price

In the 4H chart, the BCH price action showcases an immensely bullish opportunity ready to boost an uptrend. Bitcoin Cash price action forms a double bottom pattern at the $180 base with a neckline at $190 during the week-long consolidation.
Furthermore, the 4H RSI line displays a huge bullish divergence within the consolidation range, increasing the positive breakout chances.
With the lower price rejections 4H chart and bullish divergence, the BCH price may find a reversal shortly. A reversal from the 61.80% Fibonacci level and the 200-day EMA can help BCH bounce above $200. The uptrend can potentially aim at the 38.20% Fibonacci level at $228.
On the flip side, if Bitcoin Cash price crashes below $175, the BCH price to $150.
Source: https://coinpedia.org/price-analysis/bitcoin-cash-bch-price-analysis-more-than-a-savior-will-200-day-ema-prove-a-great-buying-spot/