Bitcoin enthusiasts remain bullish, breaking through the $70,000 barrier on March 11, indicating sustained interest from traders. Bitwise’s Chief Investment Officer, Matt Hougan, shared with investors that despite the anticipation for Bitcoin exchange-traded funds (ETFs), demand remains strong.
This bullishness is mirrored in the uptake of Bitcoin ETFs, as Dune Analytics data reveals that spot Bitcoin ETFs now hold 4.06% of the total Bitcoin supply. Should the current purchase pace persist, these ETF holdings are forecasted to double to 8.65% of the supply within a year. Michael Saylor, the founder and chairman of MicroStrategy, announced via a X post that his company has added 12,000 Bitcoin to its treasury at an average cost of $68,477 each, financed by a recent $800 million convertible note offering. With this addition, MicroStrategy’s Bitcoin portfolio has grown to 205,000 Bitcoin, purchased at an average of $33,706 each.
The inflow trends of Bitcoin ETFs merit close attention from traders, as a significant decline could dampen market sentiment and potentially trigger a price correction. We will dive into the charts to spotlight key support levels for Bitcoin and other cryptocurrencies.
Bitcoin (BTC) Price Analysis
experienced challenges in surpassing the $70,000 mark over the weekend but successfully exceeded this threshold on March 11, demonstrating robust demand from buyers. As a result, BTC price touched a peak of $72K. As of writing, BTC price trades at $71,788, surging over 0.8% from yesterday’s rate.
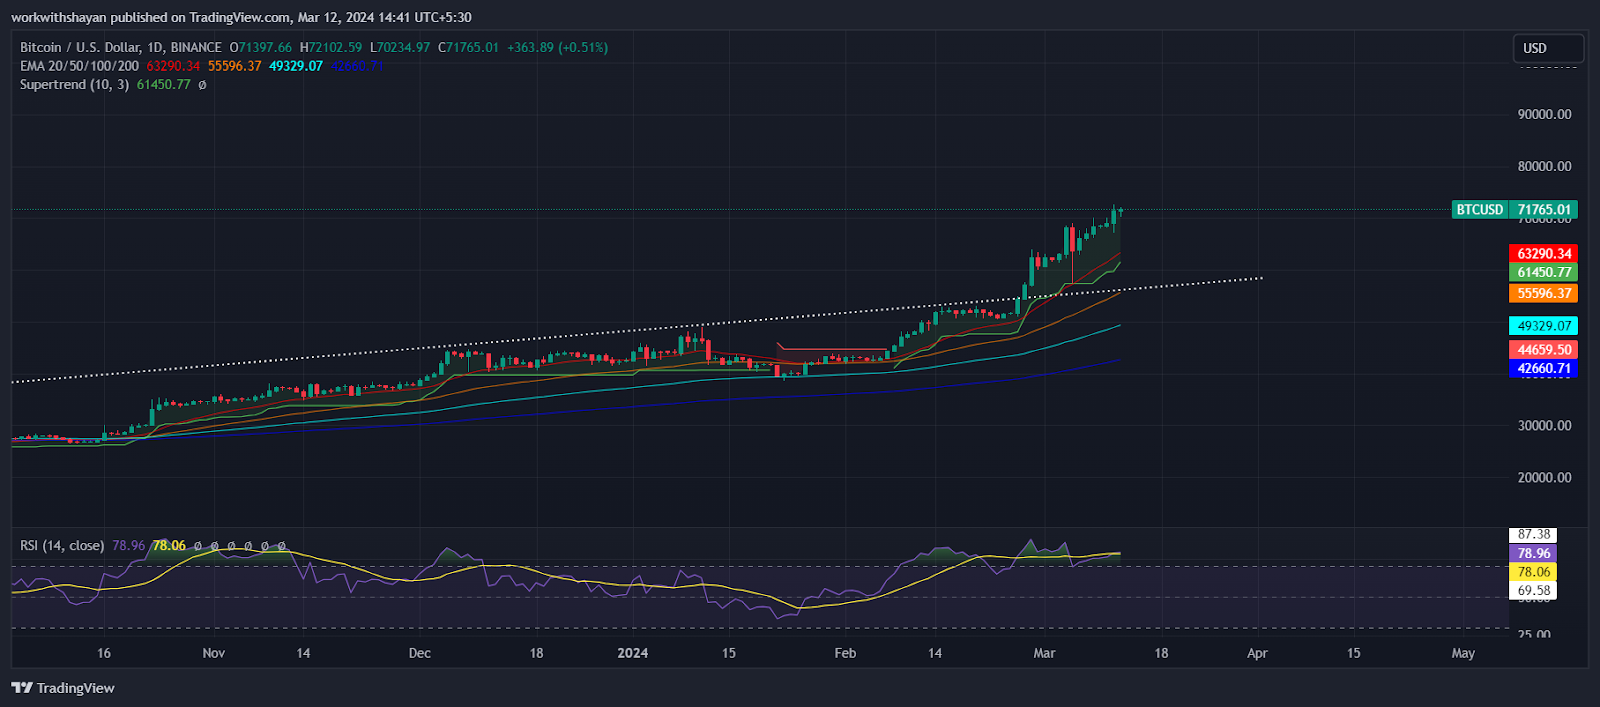
The upward trend of moving averages and the RSI positioned in the overbought territory indicate that the momentum is with the buyers. The BTC/USDT pair has the potential to climb to $75,000 and possibly extend to $80,000. This range is expected to present significant resistance.
Predicting a peak in an asset that enjoys strong momentum is challenging. The initial indication of a loss in strength will be a fall below the 20-day EMA, which would suggest that buyers are taking profits and could lead to a more substantial correction.
Ethereum (ETH) Price Analysis
The bears attempted to drive Ether down to the breakout point of $3,600, but the pronounced long tail on the March 11 candlestick indicates strong buying interest at lower prices.
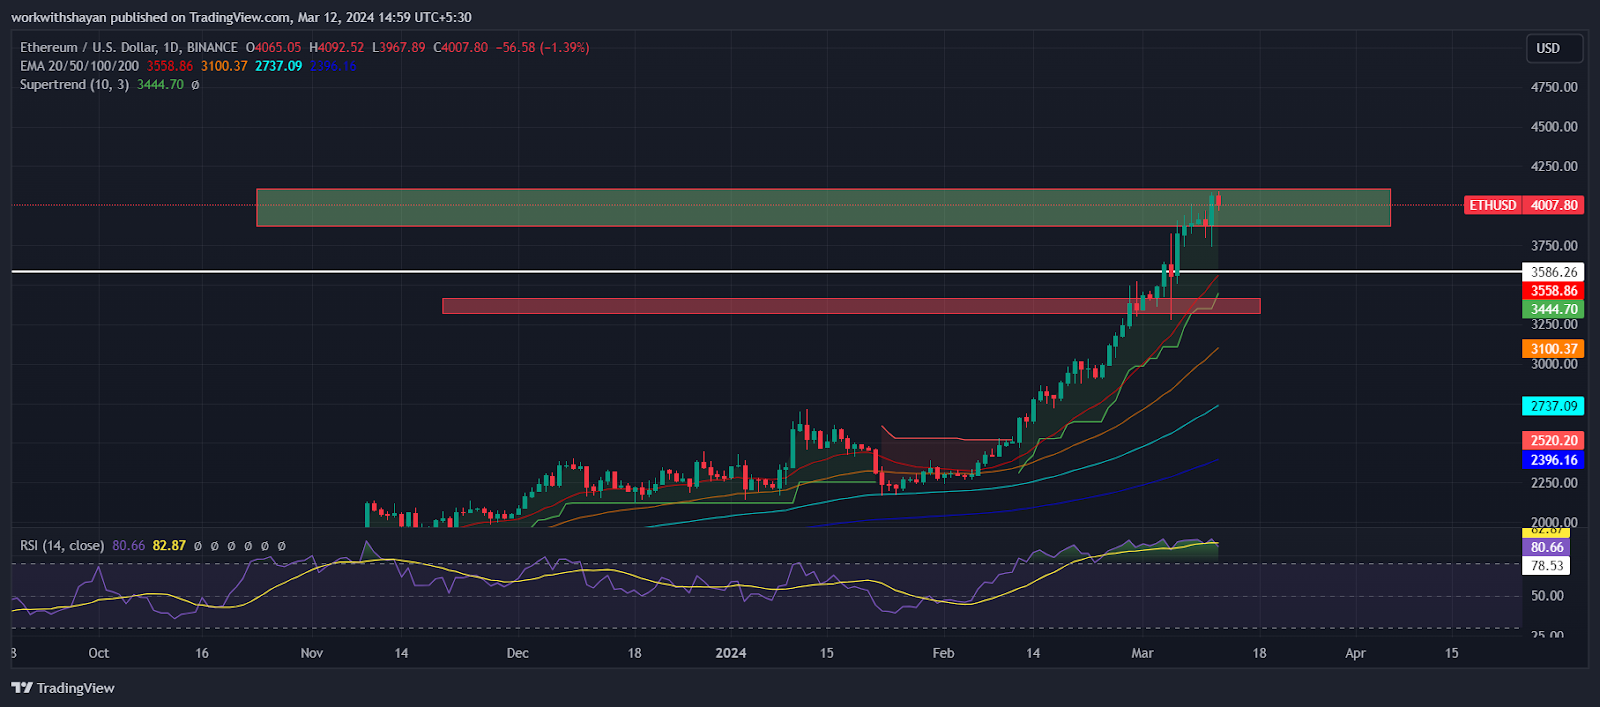
The surge past the key $4,000 level has set the stage for a potential rally to $4,500, which could pose a slight challenge. However, overcoming this resistance could send the ETH/USDT pair towards $4,900.
The recent sharp rise has elevated the RSI into the overbought zone, suggesting a need for caution. To reverse the bullish trend, sellers need to pull the price beneath the 20-day EMA, potentially triggering a corrective phase for the pair.
Theta Network (THETA) Price Analysis
THETA price has shown a robust uptrend for the past few days, gaining additional momentum once the price exceeded $3. Currently, the Theta price is trading at $3.4, declining over 5.7% from yesterday’s rate.

It appears the THETA/USDT pair could aim for $4.4 in the short-term, where it might face significant resistance. Should the bulls manage to maintain their position near this level, the uptrend could persist, potentially taking the pair up to $6.
Critical support levels are identified at $2.6 and the 20-day EMA. A pullback below the 20-day EMA would suggest a short-term cessation of the uptrend.
FLOKI Price Analysis
Bears are attempting to initiate a correction in Floki price, yet the bulls are firmly resisting, evidenced by the minimal pullback indicating a scarcity of sellers. However, sellers successfully defended a surge above the $0.0003 mark. Currently, the Floki price trades at $0.00027, declining over 2.7% from yesterday’s rate.
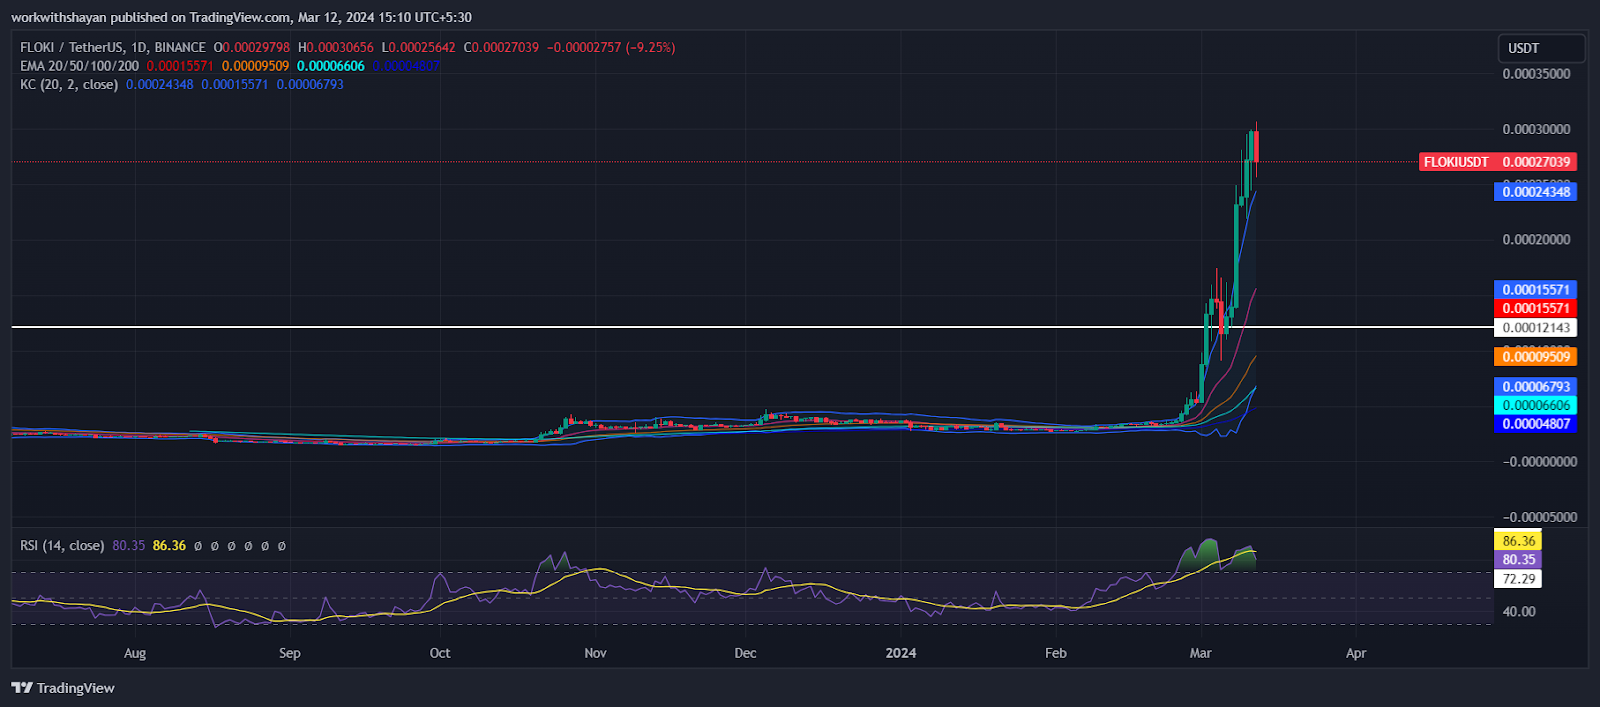
In this scenario, buyers are likely to seize the opportunity to solidify their position by driving the price above $0.0003. Achieving this could signal the continuation of the uptrend for the FLOKI/USDT pair, potentially sending it to $0.00045.
To counteract the bullish momentum, bears need to decisively pull the price below the critical level of $0.00012. Such a move could trigger increased selling, paving the way for a descent to the 50-day SMA at $0.000085.
XRP Price Analysis
The bears continuous inability to keep
below the 20-day EMA ($0.60) likely encouraged buying activity on March 11. As a result, the price tapped the $0.75 mark; however, bears defended that level strongly.
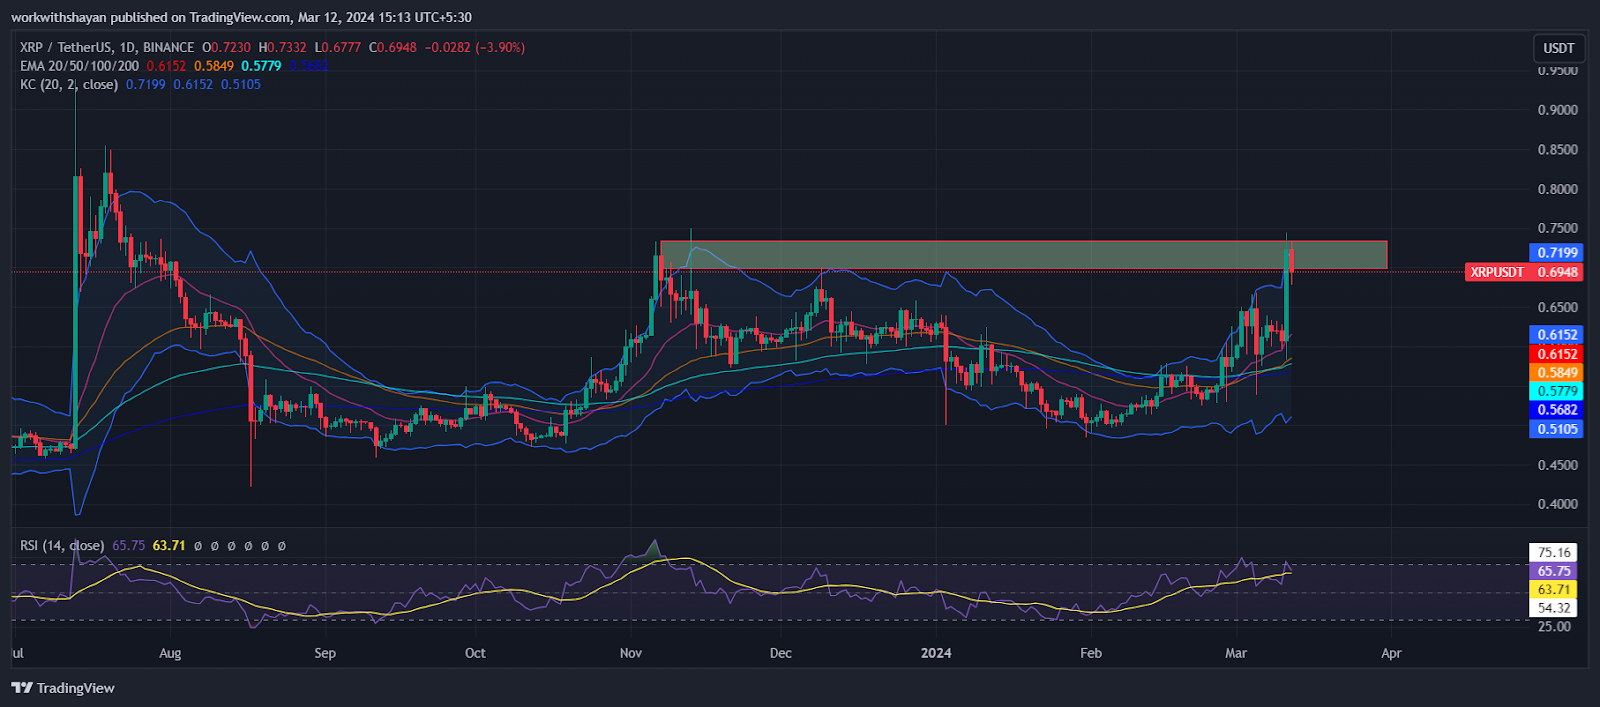
With the price moving past the near-term resistance at $0.7, there’s clear evidence of aggressive buying at lower prices. The bulls are expected to keep up the pressure and attempt to breach the significant resistance at $0.75. Overcoming this barrier would signal the beginning of a new uptrend, potentially sending the XRP/USDT pair to $0.85 and then possibly to $0.94.
Should the price retreat from $0.74, however, it would imply that bears are still exerting pressure at higher levels, possibly driving the pair back down to the robust support level at $0.6.
Source: https://blockchainreporter.net/crypto-market-price-analysis-today-bitcoin-btc-ethereum-eth-theta-network-theta-floki-xrp/