Bitcoin Analysis
Bitcoin’s price sold off below $42k briefly on Tuesday before rallying during the day’s final 4HR candle and finished the day +$148.
The BTC/USD 1D chart below from InvestingInCrypto shows bitcoin’s price once again testing a critical level of inflection at $40k. The Head & Shoulders pattern that BTC is painting could see a measured move upcoming that takes bitcoin’s price back down to test the $33k level.
Bullish divergence has failed to play out over the last week for bullish BTC traders and BTC’s price action is suffering from weak demand. If the $33k level fails to prove as a reversal point for bullish BTC market participants then $30k will be a secondary target for bearish traders and the next level of support for bulls on the daily time frame.

One piece of statistical data that may yield hope of a reversal to the upside for bullish BTC market participants is the 4HR BTC dominance chart. It appears that BTCD is attempting to rally and may have bottomed out. You can see this on the chart below from saviour25.

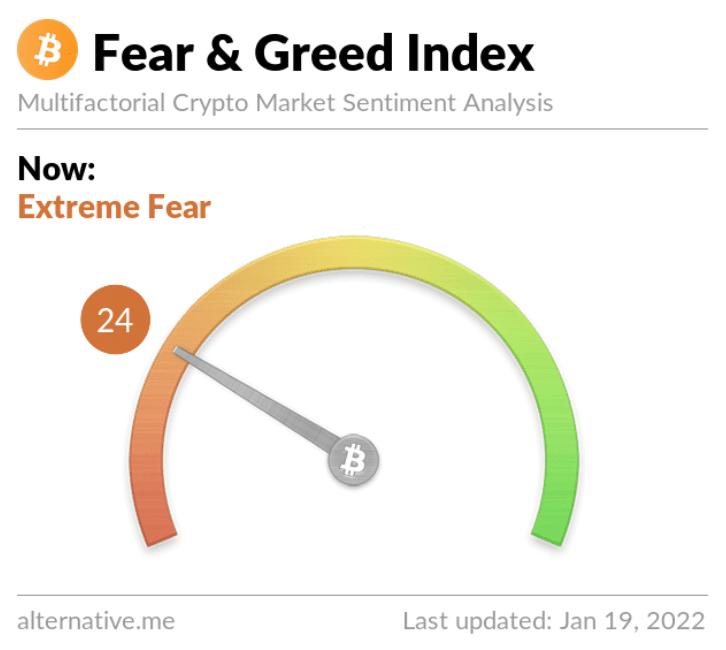
The Fear and Greed Index is 24 Extreme Fear and equal to Monday’s reading.
Bitcoin Moving Averages: 20-Day [$45,455.96], 50-Day [$51,048.58], 100-Day [$52,216.91], 200-Day [$47,330.66], Year to Date [$43,244.81].
BTC’s 24 hour price range is $41,339-$42,620 and its 7 day price range is $41,339-$44,142. Bitcoin’s 52 week price range is $28,991-$69,044.
The price of bitcoin on this date last year was $35,587.
The average price of BTC for the last 30 days is $45,570.
Bitcoin’s price [+0.35%] closed its daily candle worth $42,390. Bitcoin’s price has alternated between green and red daily candle closes for the last week.
Ethereum Analysis
Ether’s price wasn’t able to catch the same amount of bids as BTC’s price during the day’s final 4HR candle and closed Tuesday’s daily session -$49.29.
The ETH/USD 1D chart from tgreg illuminates the battleground that’s been the 0.5 fib level at $3,185. If bullish traders don’t reverse course here lower prices may be inevitable as demand for ETH has looked equally dismal to BTC over the last week.

A second Ether chart to look at is on the weekly time frame but from another chartist – RTBro. Traders can see ETH’s descending channel doesn’t provide much support for bulls if the $3,1k level is breached until $2,750 ETH.

Ether’s Moving Averages: 20-Day [$3,579.42], 50-Day [$3,987.62], 100-Day [$3,838.54], 200-Day [$3,245.05], Year to Date [$3,364.78].
ETH’s 24 hour price range is $3,099-$3,241 and its 7 day price range is $3,099-$3,395. Ether’s 52 week price range is $1,110-$4,878.
The price of ETH on this date in 2021 was $1,383.
The average price of ETH for the last 30 days is $3,593.
Ether’s price [-1.54%] closed its daily candle on Tuesday worth $3,159 and in red digits for a second straight day.
Solana analysis
Solana’s price rallied marginally during Tuesday’s daily candle and finished the day +$1.42.
The SOL/USD 4HR chart below from Mr_Wogbe_Alex shows that Solana’s price is also in a long term descending channel.
Bullish Solana traders are battling to hold support at the $140 level with the next support level being $130 for bulls. If bearish SOL market participants have their way, they’ll push SOL’s price below $130 and test the next support level for bulls at $124.76.
With a failed bullish breakout of the top of SOL’s channel at $150, the probability may be to test the bottom of the channel again before a reversal is possible to test higher prices.

Solana’s 24 hour price range is $134.87-$141.89 and its 7 day price range is $134.87-$157.22. SOL’s 52 week price range is $2.53-$259.96.
Solana’s price on this date last year was $3.64.
The average price for SOL over the last 30 days is $163.21.
Solana’s price [+1.02%] closed its daily session worth $141.24 on Tuesday and has finished in green figures for four of the last five days.
Source: https://en.cryptonomist.ch/2022/01/19/bitcoin-42k-ethereum-31k-solana-price-analyses/