Bitcoin Analysis
The first chart for analysis this Wednesday is the BTC/USD 6M chart below from entertheroach. BTC’s price is trading between the 0.236 fibonacci level [$16,256.63] and the 0 fib level [$68,788.88], at the time of writing.
This chartist denotes that their opinion is that it’s significantly important for Bitcoin’s price to close the 6 month candle on December 31st above the $16,256 level.

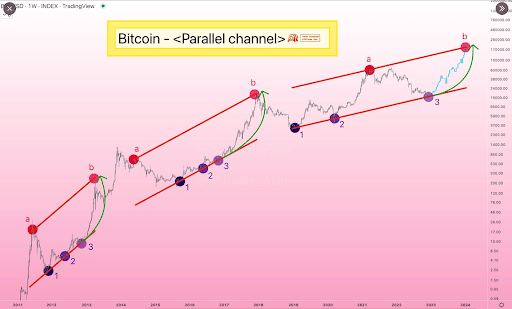
It’s also interesting and potentially revealing to look at the BTC/USD 1W chart from @TATrader_Alan and the parallel channels outlined below. We can see historically after three bottom hits of the support channel during bear trends that BTC’s price begins its next bull cycle.
Bitcoin’s Moving Averages: 5-Day [$16,818.95], 20-Day [$17,013.44], 50-Day [$17,823.68], 100-Day [$19,180.61], 200-Day [$24,844.45], Year to Date [$28,336.88].
BTC’s 24 hour price range is $16,575-16,908 and its 7 day price range is $16,575-$16,908. Bitcoin’s 52 week price range is $15,501-$50,710.
The price of Bitcoin on this date last year was $47,554.
The average price of BTC for the last 30 days is $16,940.7 and its +1.9% for the same duration.
Bitcoin’s price [-1.34%%] closed its daily candle worth $16,719 and in red figures on Tuesday.
Ethereum Analysis
The second chart on the docket today is the ETH/USD 4HR chart by HeadquarterOfTrade. ETH’s price is trading between the 0.236 fibonacci level [$1,199.08] and 0.382 [$1,228.69], at the time of writing.
The targets to the upside of the 4HR time frame for bullish traders are 0.382, 0.5 [$1,252.62], 0.618 [$1,276.56], 0.786 [$1,310.63], and the 1 fib level [$1,354.03].
Contrariwise, bearish market participants are aiming to send Ether’s price below the 0.236 again. If they’re successful at pushing ETH’s price below the 0.236, their aim shifts to a secondary target of the 0 fib level [$1,151.21] where bulls pivoted on the 19th of this month.

Ether’s Moving Averages: 5-Day [$1,216.28], 20-Day [$1,249.58], 50-Day [$1,303.09], 100-Day [$1,416.50], 200-Day [$1,744.63], Year to Date [$1,997.01].
ETH’s 24 hour price range is $1,186-$1,224 and its 7 day price range is $1,186-$1,224. Ether’s 52 week price range is $883.62-$4,037.04.
The price of ETH on this date in 2021 was $3,793.17.
The average price of ETH for the last 30 days is $1,238.45 and its +1.63% over the same period.
Ether’s price [-1.31%] closed its daily candle on Tuesday worth $1,211.55 and in negative figures for the second time in six days.
XRP Analysis
The XRP/USD 2W chart from krjcrypto is the final chart we’re providing analysis for this Wednesday. XRP’s price is trading between the 0.382 fibonacci level [$0.315] and the 0.5 fib level [$0.438], at the time of writing
The targets for bullish XRP market participants above the 0.5 fib level are as follows, 0.618 [$0.617], 0.66 [$0.689], 0.707 [$0.801], 0.75 [$0.894], and the 0.786 [$0.997] fib level on the 2 week timescale.
Conversely, bearish traders are aiming to send XRP’s price back down to retest the 0.382 fib level. If they’re successful at cracking that level, their secondary target is the 0.34 fib level [$0.279]. Below that level the interim targets for bearish XRP traders are 0.293 [$0.246], 0.25 [$0.221] and the 0.236 [$0.209].

Ripple’s 24 hour price range is $0.358-$0.372 and its 7 day price range is 0.358-$0.372. XRP’s 52 week price range is $0.287-$0.926.
Ripple’s price on this date last year was $0.85.
The average price of XRP over the last 30 days is $0.376 and its -9.56% for the same duration.
Ripple’s price [+0.45%] closed its daily session worth $0.367 and in positive figures for a second straight session on Tuesday.
Source: https://en.cryptonomist.ch/2022/12/28/bitcoin-ethereum-xrp-value-analyses/