The market leader, Bitcoin, successfully achieved its $51,000 mark today, resulting in the cryptocurrency market experiencing a significant bullish movement in their respective portfolios. Further, the AI category has hinted at the potential of massive price action in the coming days, indicating a strong bullish influence for these tokens in the industry.
Moreover, the top tokens of this category, such as Injective (INJ), Render (RNDR), and Internet Computer (ICP), continue to record significant uptrends in their respective charts despite the increased price volatility in the crypto industry.
Injective Price To Surge 20%
The Injective price traded in a consolidated range between $35.11 and $38.94 for a period, following which the bulls gained momentum and jumped 25% in valuation, after which the price faced rejection at $43.93 and erased maximum gains from the pump. After this, the price traded between $36.67 and $41.53 for the next eight days.
As the market volatility grew, the bulls lost momentum and recorded a 15% loss. Following this, the price traded sideways for a while and, after multiple attempts, recorded a breakout. However, the rally was short-lived, and the price experienced a pullback in the chart. Since then, the price has been trading between $33.64 and $36.67, indicating weak price action.
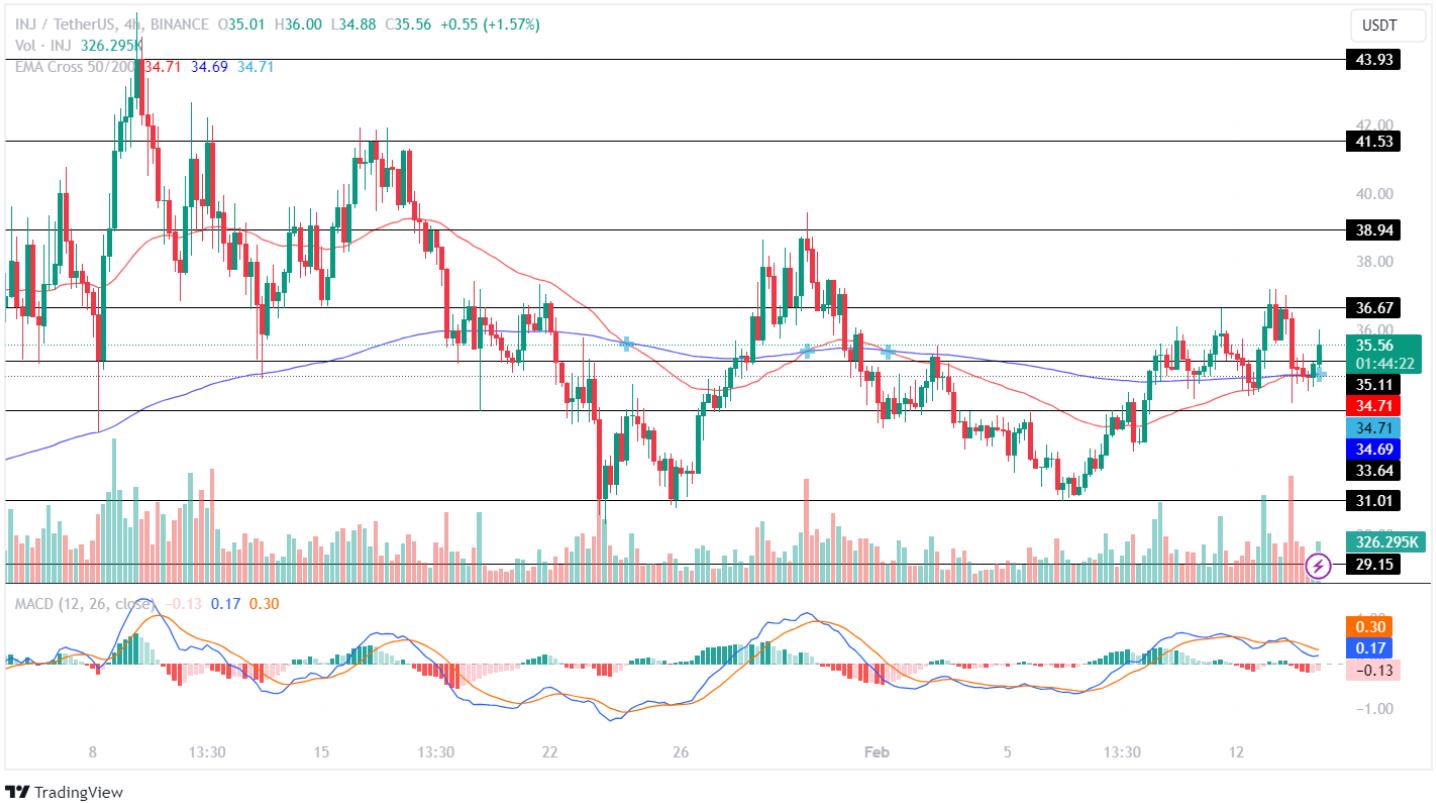

The MACD displays a decline in the red histogram, indicating an increase in the buying pressure in the market. Further, the averages show a bullish curve, suggesting the price will experience significant price action in the coming time.
If the market holds the price above the support level of $35.11, the bulls will regain momentum and test its resistance level of 36.67. Maintaining the price at that level will set the stage for the Injective price to attempt to test its upper resistance level of $41.53 this month.
Conversely, if the bears overpower the bulls, the price will lose momentum and fall to test its support level of $33.64. Moreover, if the bears continue to dominate the market, it will plunge and prepare to test its crucial support level of $31.01 in the upcoming weeks.
Also Read: After Some Bearish Glory, Bitcoin Coiling Up to $50,000: Is It the Time to Push to ATH?
Internet Computer Price Tests Its Crucial Levels
The ICP price traded in a narrow space between $11.871 and $12.486 for a while, following which the market lost momentum, and the price recorded a loss of over 17% in valuation. However, the bulls quickly regained momentum and jumped over 35%, after which the price traded in a consolidated range between $12.486 and $13.966 for a brief period.
Following this, the market lost momentum and lost over 30.5% in value. After this, the bulls gained momentum and added approximately 41% to its portfolio during the next eleven days, before facing rejection below the resistance level of $13.966. Since then, the price has been trading in a consolidated range between $11.781 and $13.966.
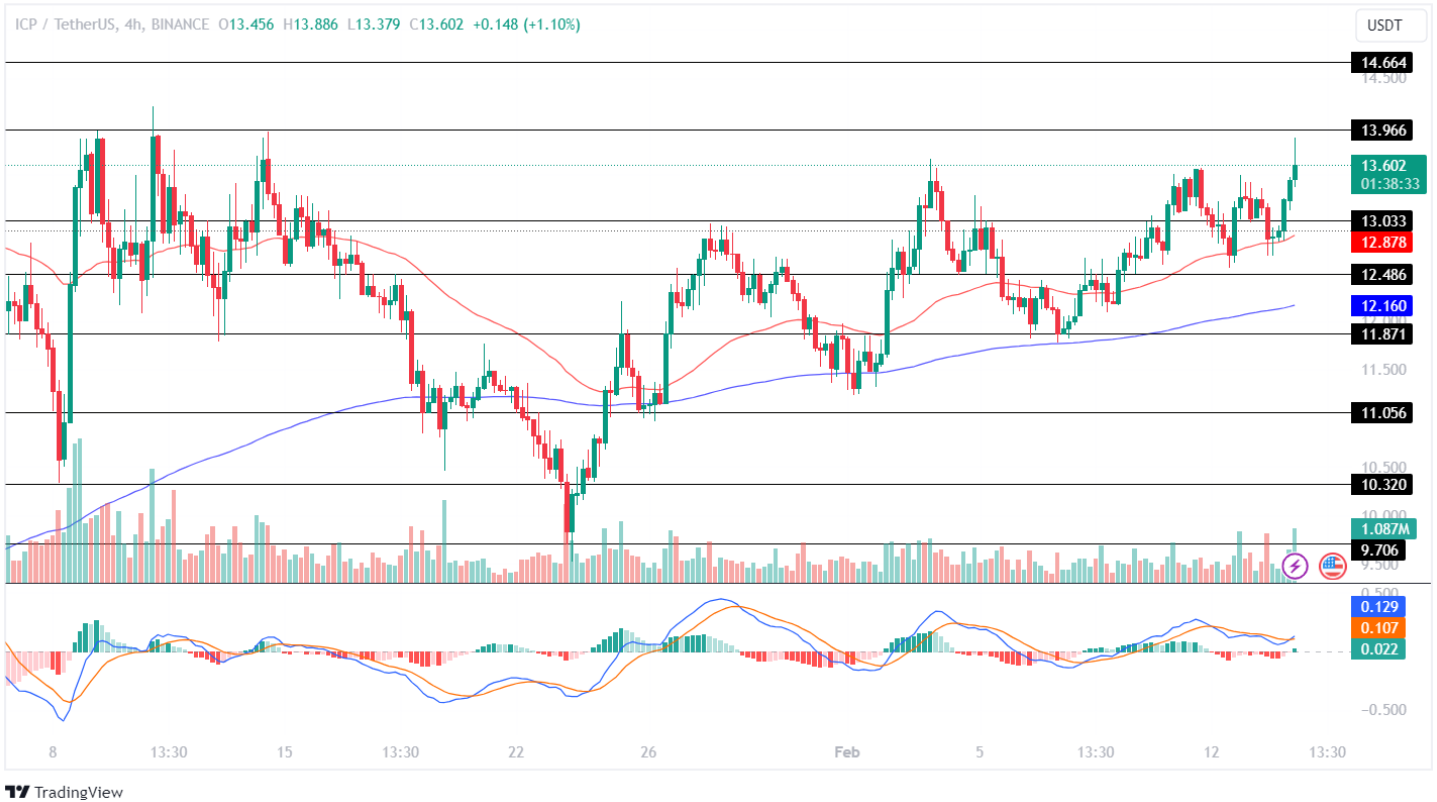
The Moving Average Convergence Divergence (MACD) displays a rise in the green histogram, indicating an increase in the buying-over-selling pressure in the crypto space. Moreover, the averages show a bullish convergence, suggesting the price is preparing to experience significant price action in the coming time.
If the bulls continue to gain momentum, the ICP price will test its resistance level of $13.966 this week. Further, if the market holds the price at that level, Internet Computer price will prepare to test its upper resistance level of $14664 in the upcoming weeks.
Negatively, if a trend reversal occurs, the bulls will lose power, and the price will fall to test its support level of $13.033. If the bears continue to hold power over the bulls, the ICP price is predicted to bleed further and prepare to test its crucial support level of $11.871.
Render Token Price On The Verge Of A Major Breakout
The RNDR price traded between $3.743 and $3.947 for a while, after which the bulls lost momentum, resulting in a price breakdown. The bulls quickly regained momentum and jumped over 20%. Following this, the Render token price traded between $3.743 and $4.159 for three weeks, during which the price recorded significant volatility in the chart.
After testing its low of $3.457, the market volatility increased, and the bulls regained momentum and jumped 22.5% over the next six days. Following this, the price traded sideways, indicating a cool-off in the price action. Recently, the bulls regained momentum and successfully broke out of the range and have been traveling sideways since then.
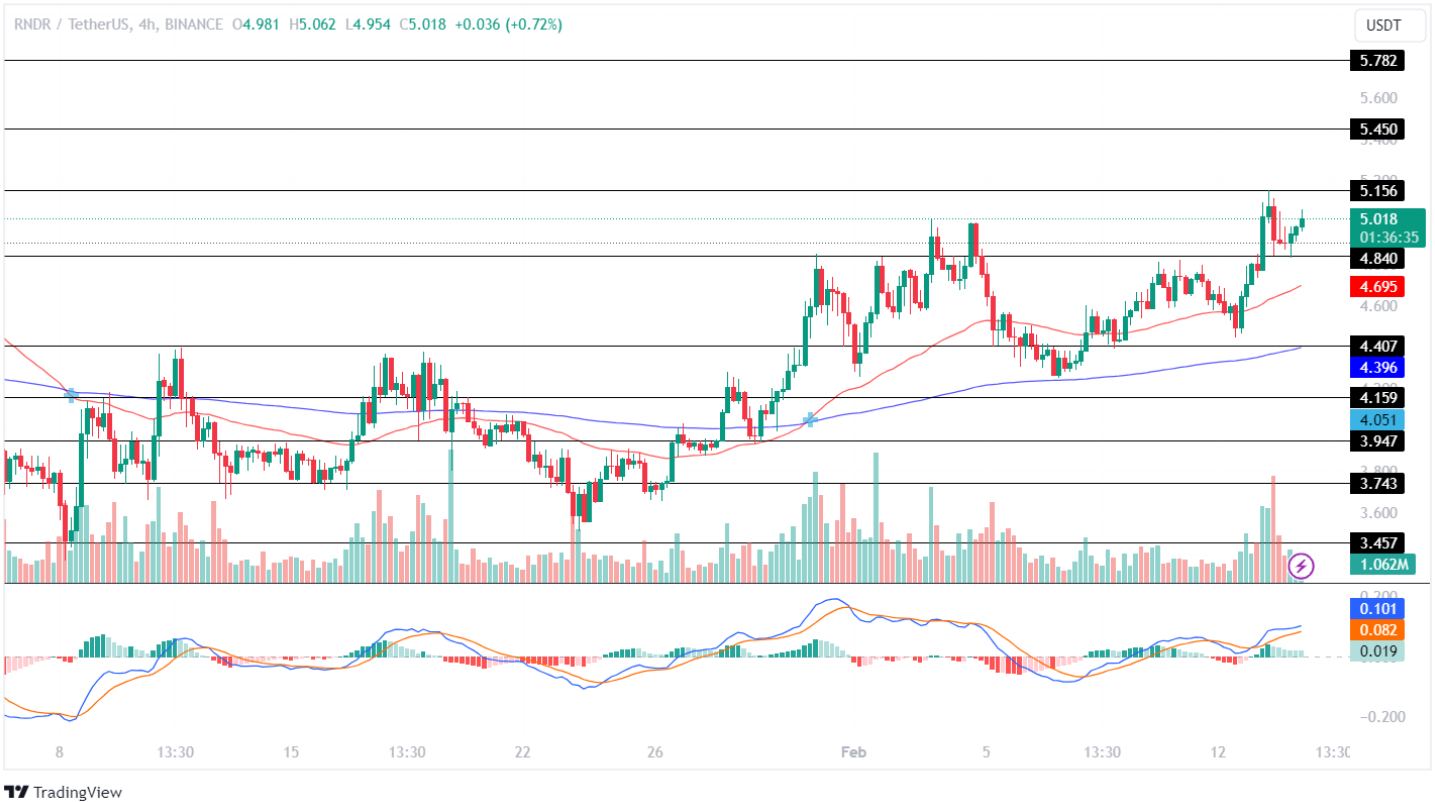
The technical indicator, MACD, records a constant decline in the green histogram and highlights a bearish influence despite an increase in the buying pressure in the market. Further, the averages show a constant rise, suggesting a mixed sentiment in RNDR’s future price action.
If the bulls regain momentum, it will test its resistance level of $5.156 by the weekend. Moreover, if the market holds the price at that level, it will continue to rise and test its upper resistance level of $5.450 this month.
Conversely, if the bears overpowered the bulls, the price would lose momentum and prepare to test its support level of $4.840. Further, if the bears continue to gain control, it will plunge and prepare to test its $4.407 in the upcoming weeks.
Akash Network On A Path To Achieve New High
The Akash Network price traded between $2.7598 and $3.2979 for a while, after which the market volatility increased, and the token recorded a correction of over 14% in valuation. Following this, the price traded sideways for the next seven days. After this, the AKT price recorded significant fluctuations in the chart and recorded a low of $2.3196.
After this, the bulls regained momentum and jumped over 30% over the next five days. The AKT coin price then traded sideways for half a month. After multiple attempts to break out, the bulls successfully regained momentum and since have been trading in a rising pattern, highlighting a bullish sentiment in the crypto space.
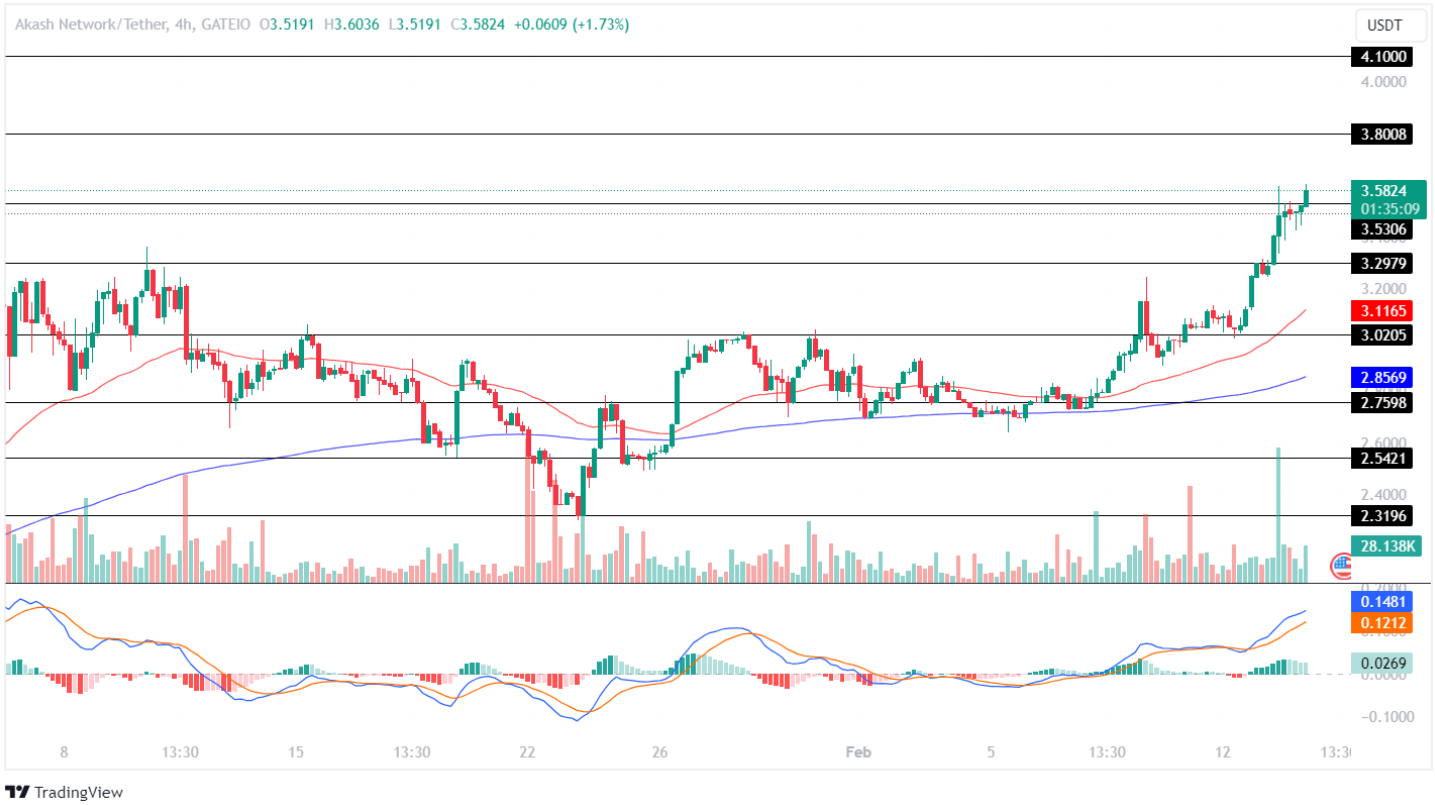
The MACD shows a constant rise in the averages, suggesting a strong bullish influence in crypto. Further, the histogram indicates a decline in the chart, indicating uncertainty in the future price action of the coin as it displays a mixed sentiment.
If the market holds the price above the resistance level of $3.5306, the bulls will regain momentum, and the AKT price will attempt to test its upper resistance level of $3.880. Maintaining the price at that level will set the stage for the AKT price to attempt to test its upper resistance level of $4.10.
Negatively, if the market fails to hold the price above its support, the bulls will lose momentum and fall to test its support level of $3.2979. Moreover, if bears continue to dominate the market, the Akash Network price will continue losing momentum and prepare to test its crucial support level of $3.0205
Conclusion:
The Artificial Intelligence (AI) industry is recording stronger market trends daily, indicating a rise in interest among its investors. Top tokens from the AI category successfully outperformed all the major crypto coins during the previous year, and the same is expected from them this year, making them a top pick for one to research.
However, it is best to deeply research before investing in any asset as the market is highly volatile and is known to constantly record massive price fluctuations within a short period, the outcome of which could result either way.
Source: https://coinpedia.org/price-analysis/top-4-ai-based-altcoins-poised-to-surge-20-as-bitcoin-hits-51000/