Cryptocurrencies are in a downtrend after being rejected at the superior resistance levels. Altcoins are in a move below the moving average lines. There is a risk of further decline when the price bars are below the moving averages.
Nexo
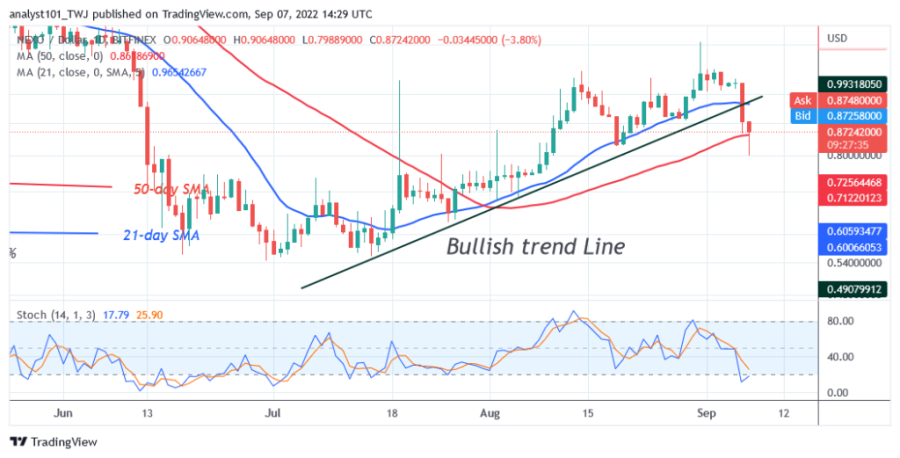
Nexo (NEXO) is in an uptrend, but is encountering resistance at the $1.21 high. The altcoin has retreated below the 21-day line SMA. In other words, the cryptocurrency is trading between the moving average lines. NEXO will resume its uptrend if the price rises above the 21-day line SMA. The altcoin will rise and reach the resistance at $1.21 again. A break above this resistance will signal the resumption of the uptrend.
Conversely, the downtrend will resume if the price breaks below the 50-day line SMA. The current uptrend should be over. NEXO will continue to fall to the low of $0.57. Meanwhile, the altcoin is below the 20% range of the daily stochastic. This means that the market has reached the oversold zone. Selling pressure will ease when buyers appear in the oversold region. NEXO is the cryptocurrency asset with the lowest performance this week. It has the following characteristics:
Price: $0.8636
Market capitalization: $863,295,357
Trading volume: $16,133,161
7-day loss: 21.27%
Helium
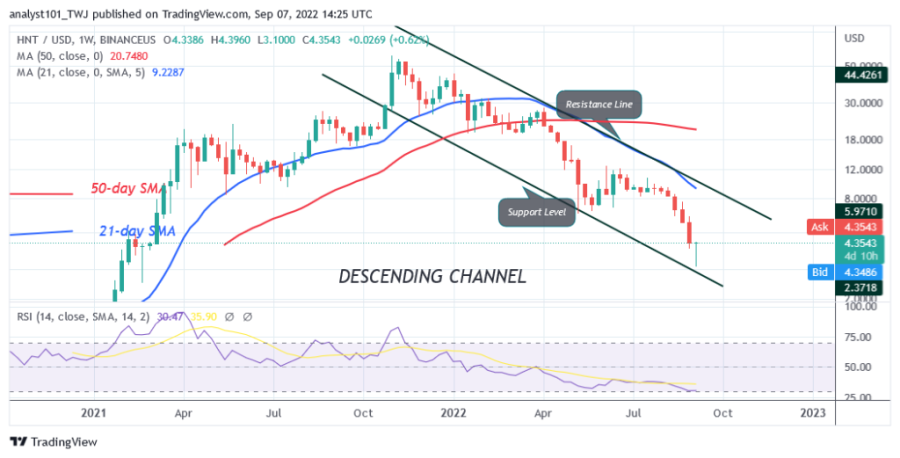
The price of Helium (HNT) is in a downtrend as it drops below the moving average lines. The cryptocurrency drops to the low of $3.98 as the bulls buy the dips. In the previous uptrend, HNT rose to a high of $57. The bulls failed to sustain the bullish momentum as the altcoin reached an overbought region.
Today, the altcoin fell to the low of $3.98, which is an oversold region of the market. Meanwhile, HNT is at level 30 of the Relative Strength Index of period 14, indicating that the market has reached the oversold region. Selling pressure is likely to ease as buyers emerge in the oversold region. It is the cryptocurrency with the second worst performance this week. It has the following characteristics:
Price: $4.78
Market capitalization: $1,066,727,746
Trading volume: $119,112,527
7-day loss: 21.19%
Kava
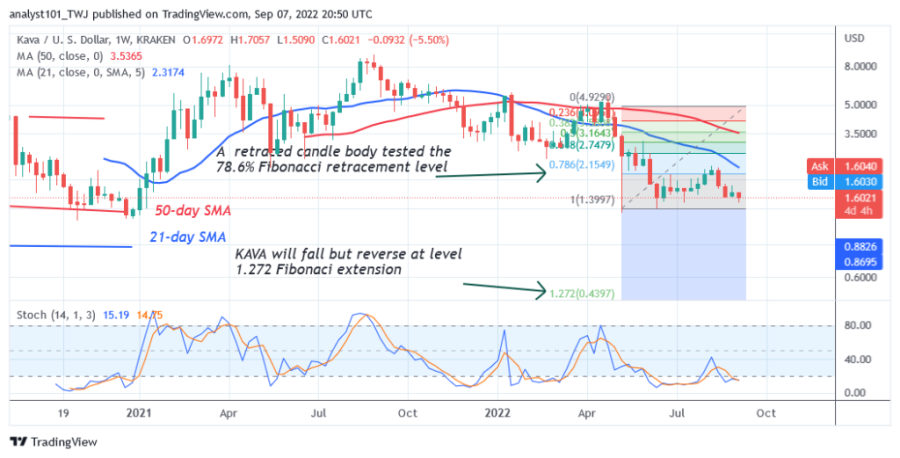
The price of Kava (KAVA) is in a downtrend and has dropped significantly. The altcoin was previously in a sideways trend as it struggled against overhead resistance at $7.00. The cryptocurrency drops to the low of $1.32 and continues to consolidate above the current support. The current support at $1.32 was tested three times, but sellers failed to break the current support.
Meanwhile, on August 9 downtrend, a retraced candle body tested the 78.6% Fibonacci retracement level. The retracement suggests that KAVA will fall, but reverse at the level of 1.272 Fibonacci extension or $0.43.
The altcoin is below the 20% area of the daily stochastics. The market has reached the oversold area. The selling pressure is likely to ease. It is the cryptocurrency asset with the third worst performance this week. It has the following characteristics:
Price: $1.59
Market capitalization: $404,305,403
Trading volume: $11,661,522
7-day loss: 19.37%
Flow
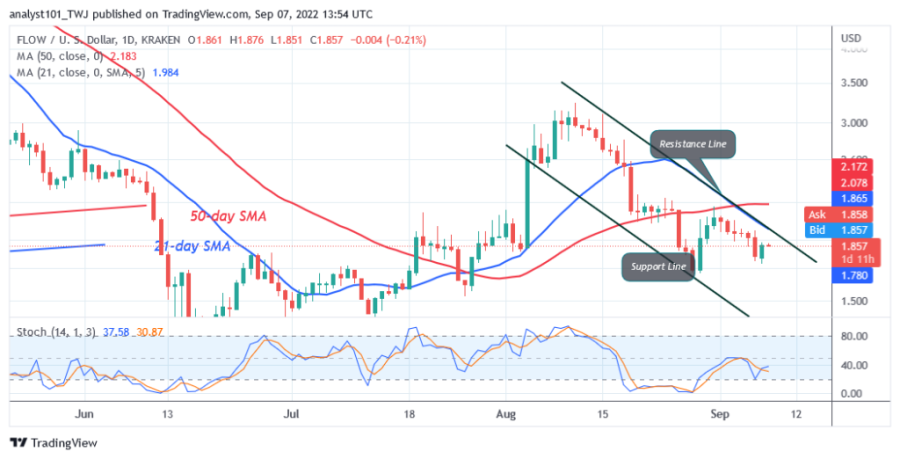
Flow (FLOW) price is in a downtrend as the altcoin broke below the moving average line. On August 28, the cryptocurrency fell to a low of $1.67 as bulls bought the dips. The altcoin fell into an oversold area of the market. Selling pressure has eased as the altcoin fluctuates below the moving average lines. If the bulls break the moving average lines to the upside, FLOW will rise and retarget the overriding resistance of $3.00.
In the meantime, the altcoin is fluctuating between $1.67 and $2.16. FLOW is above the 40% area of the daily stochastic. The cryptocurrency is in a bullish momentum. It is the cryptocurrency with the fourth worst performance this week. It has the following characteristics:
Price: $1.87
Market capitalization: $2,582,785,482
Trading volume: $30,325,556
7-day loss: 12.93%
Chiliz
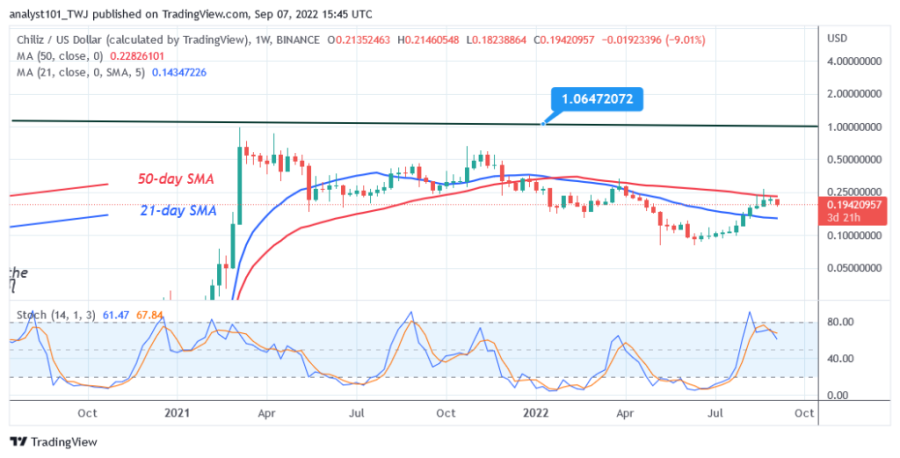
Chiliz (CHZ) is in a sideways trend as the cryptocurrency fluctuates below the $1.00 overhead resistance. On September 8, Chiliz rallied to the $1.00 overbought area. The altcoin was pushed back as it moved back into a range. Today, CHZ is trading between the moving average lines.
The cryptocurrency will develop a trend when the moving average lines are broken. For example, if the bulls break the 50-day line SMA, the altcoin will rise and retest the overriding resistance. It is located below the 80% area of the daily stochastics. The cryptocurrency is in bearish momentum.
However, CHZ is the cryptocurrency with the fifth worst performance this week. It has the following characteristics:
Price: $0.1933
Market capitalization: $1,719,427,074
Trading volume: $245,564,454
7-day loss: 12.62%
Disclaimer. This analysis and forecast are the personal opinions of the author and are not a recommendation to buy or sell cryptocurrency and should not be viewed as an endorsement by Coin Idol. Readers should do their own research before investing in funds.
Source: https://coinidol.com/altcoins-sideways-move/

