Disclaimer: The information presented does not constitute financial, investment, trading, or other types of advice and is solely the writer’s opinion
- Aave offered a short-term bullish possibility but could face rejection upon a rally
- Even so, this could offer traders the opportunity to trade both long and short positions on the asset in the coming weeks
Aave was at an interesting place on the price charts. Higher timeframe momentum was bearish, but the market structure on the 12-hour and daily charts flipped to bullish in the past couple of days. The lower timeframe charts also showed bullish momentum.
Read Aave’s Price Prediction 2023-24
Can the bulls trust this flip, and look to position themselves long? Or, can traders look to remain patient and wait for a move into the $72 area before loading their short positions? A stiff resistance zone lay ahead for AAVE, that much was certain.
FVG and bearish breaker lie in the vicinity of $72
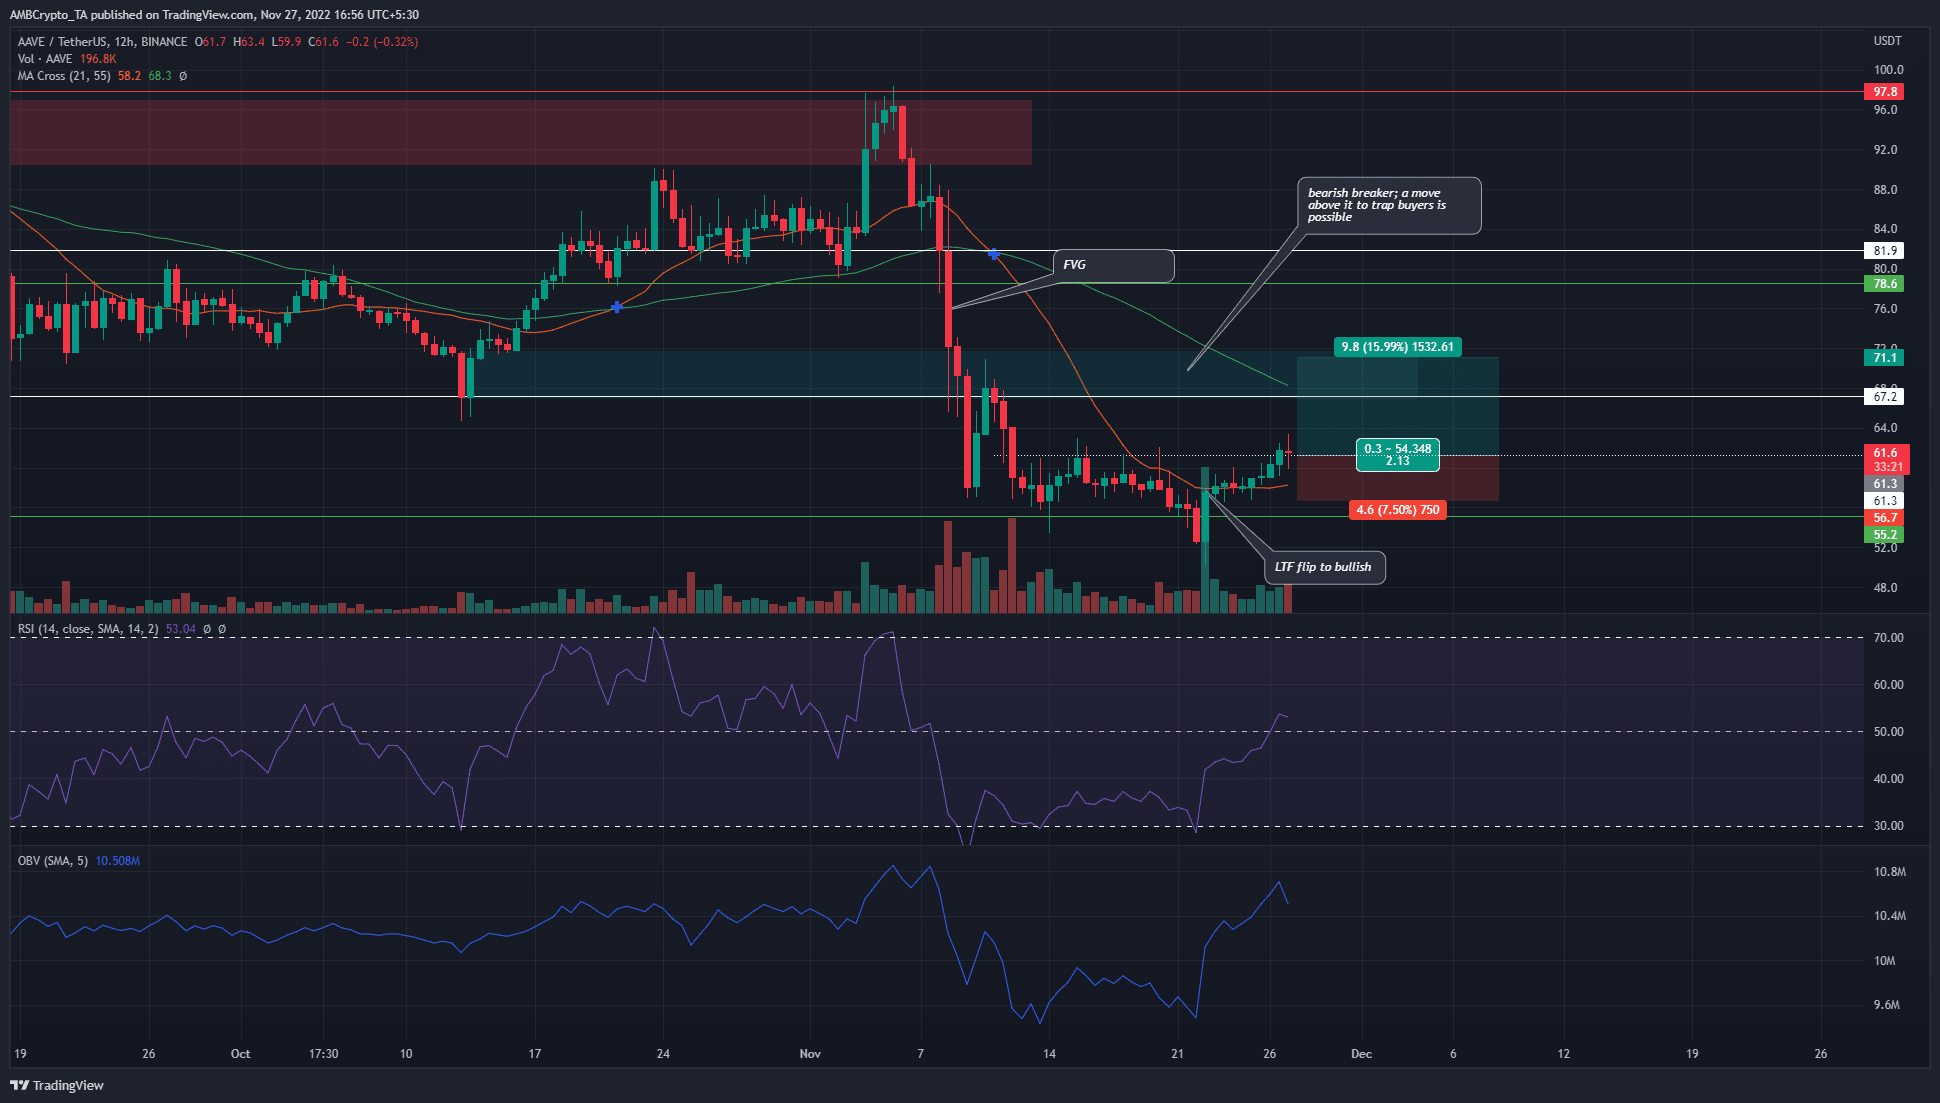
Source: AAVE/USDT on TradingView
A move upward followed by a downward push once more was likely for AAVE. Why is that? On the lower timeframes, the market structure was bullish for Aave. It climbed past $61.3 over the previous day of trading and has seen a surge of nearly 18% in the past five days.
The market structure of the 12-hour chart broke toward the bullish side. Even though the moving averages showed bearish momentum, the lower timeframe rally can see Aave drive toward an area of importance to the north.
The RSI climbed above neutral 50 at the time of writing, while the OBV also climbed to show strong buying volume.
During the drop in prices earlier this month, AAVE left an inefficiency (fair value gap) on the charts from $73.2 to $78. Just below this area, a bearish breaker from October posed resistance near the $70 region.
Therefore the price could rally toward the $70-$75 region. Such a move would embolden the bulls, and this would provide the liquidity needed for larger players to carry out a sharp price reversal to the south once more.
Hence, aggressive traders can look to position themselves long. The bullish market structure break suggested bulls can look to re-enter on a retest of the $61.3-$62 area, targeting $70. A conservative stop-loss order can be set near $56.7, or even higher at $59.1.
Supply on exchanges sees a sharp drop alongside the price and mean coin age
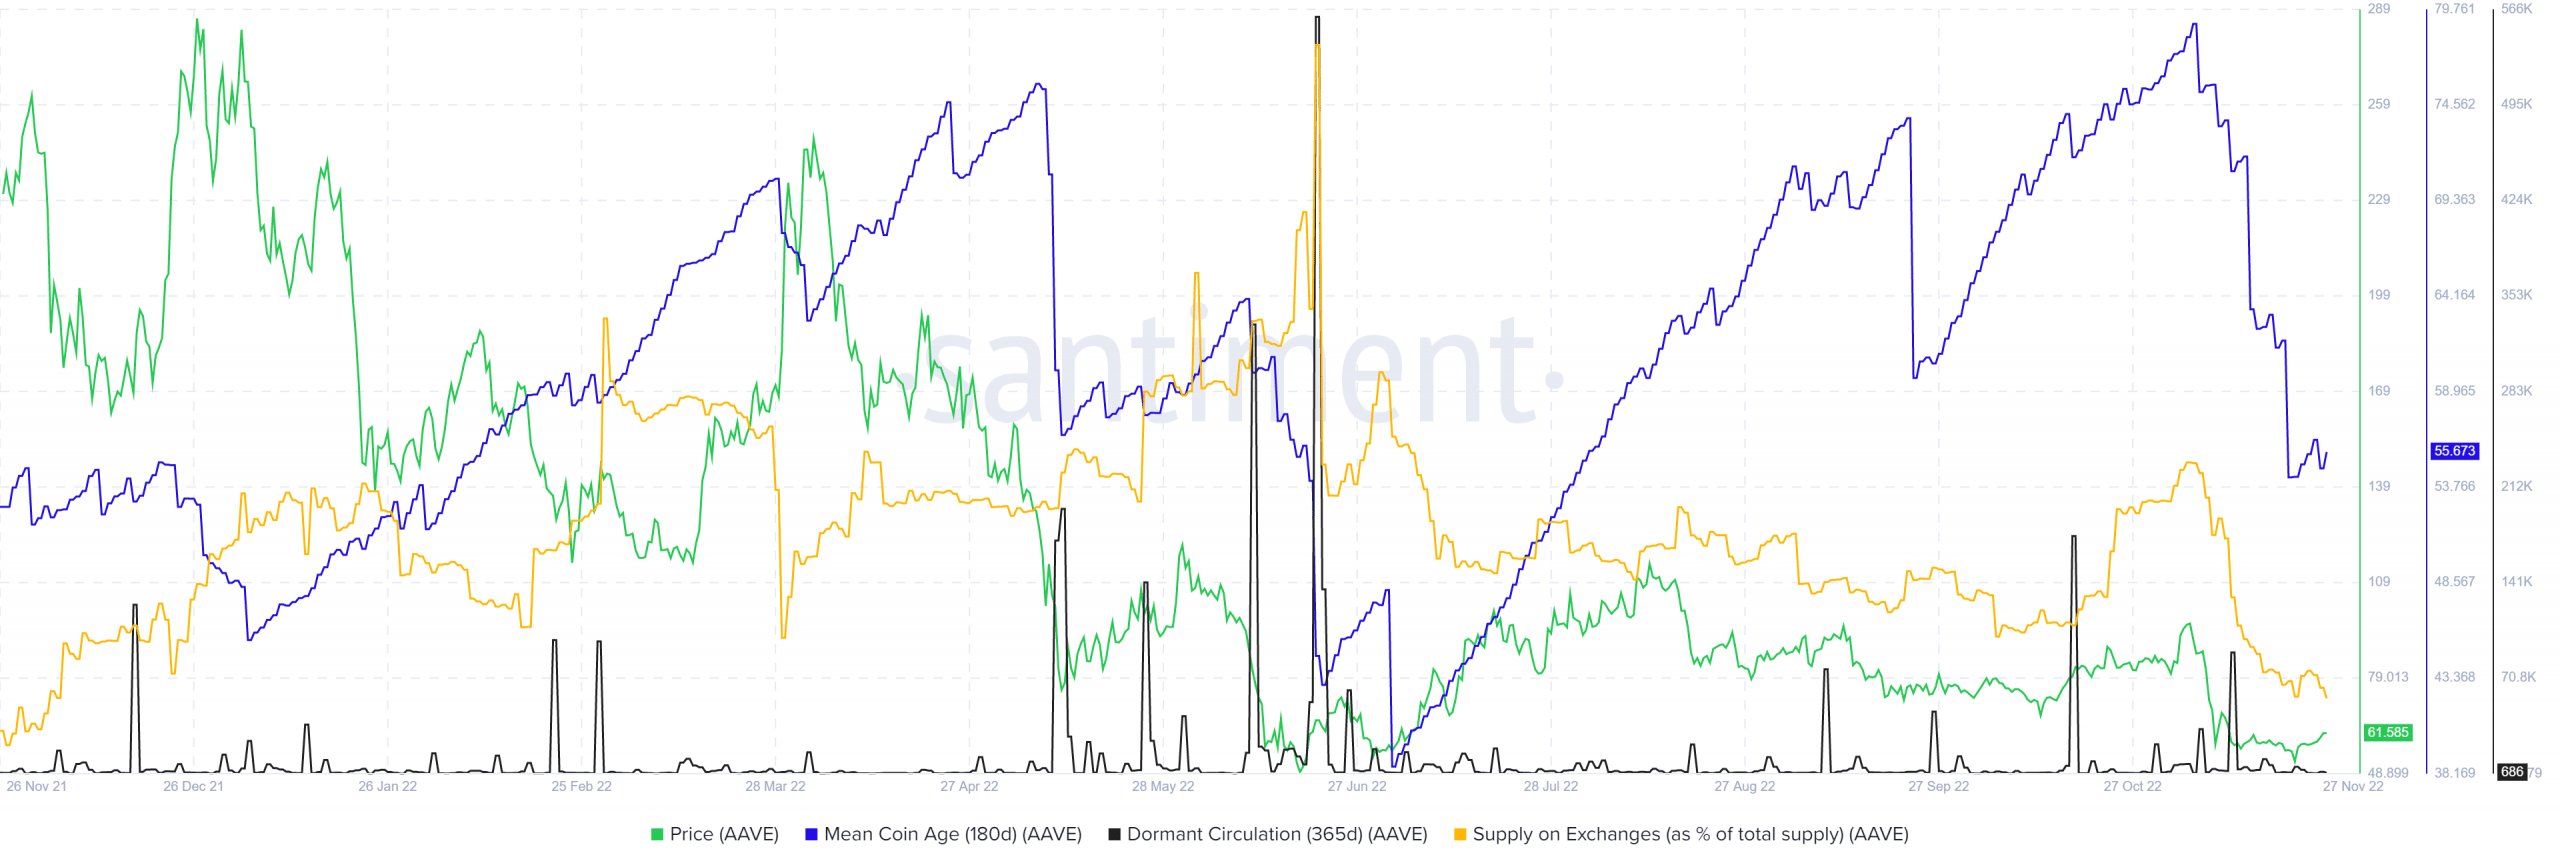
Source: Santiment
During the early November drop, the mean coin age metric and the supply on exchanges both witnessed a sharp drop. Previously, they had been on an uptrend. The price was in a lower-term uptrend too as AAVE rallied from $67 in mid-October to $94 in the space of three weeks.
The descent of both these metrics was due to selling pressure. After the drop, it was likely that coins were moved off exchanges as bulls bought the dip back to a support level from June.
The fall in mean coin age also meant increased AAVE movement between addresses. Meanwhile, the dormant circulation also saw a spike in recent weeks as longer-term holders moved their coins. Their intention could have been to sell the tokens.
As highlighted already, it was likely that an AAVE foray above $70 would face rejection and be followed by a move back toward the $56 region. If Bitcoin manages to rally past $18.6k, Aave can also hope to break past the shackles at $75. An uptrend on the mean coin age can be used to add credence to the bullish case, if that happened.
Source: https://ambcrypto.com/aave-shows-promise-of-a-move-to-75-but-will-the-bears-stop-the-rally/