After failing to close above the $2.16 zone last week, the XRP price today is consolidating near the $2.02 level as bearish momentum fades but upside conviction remains weak. Despite several short-term rebound attempts, sellers continue to defend the $2.10–$2.16 resistance cluster, keeping XRP trapped below its dynamic EMA zones.
Traders are now closely monitoring structural levels and momentum shifts ahead of the June 27 options expiry.
What’s Happening With XRP’s Price?
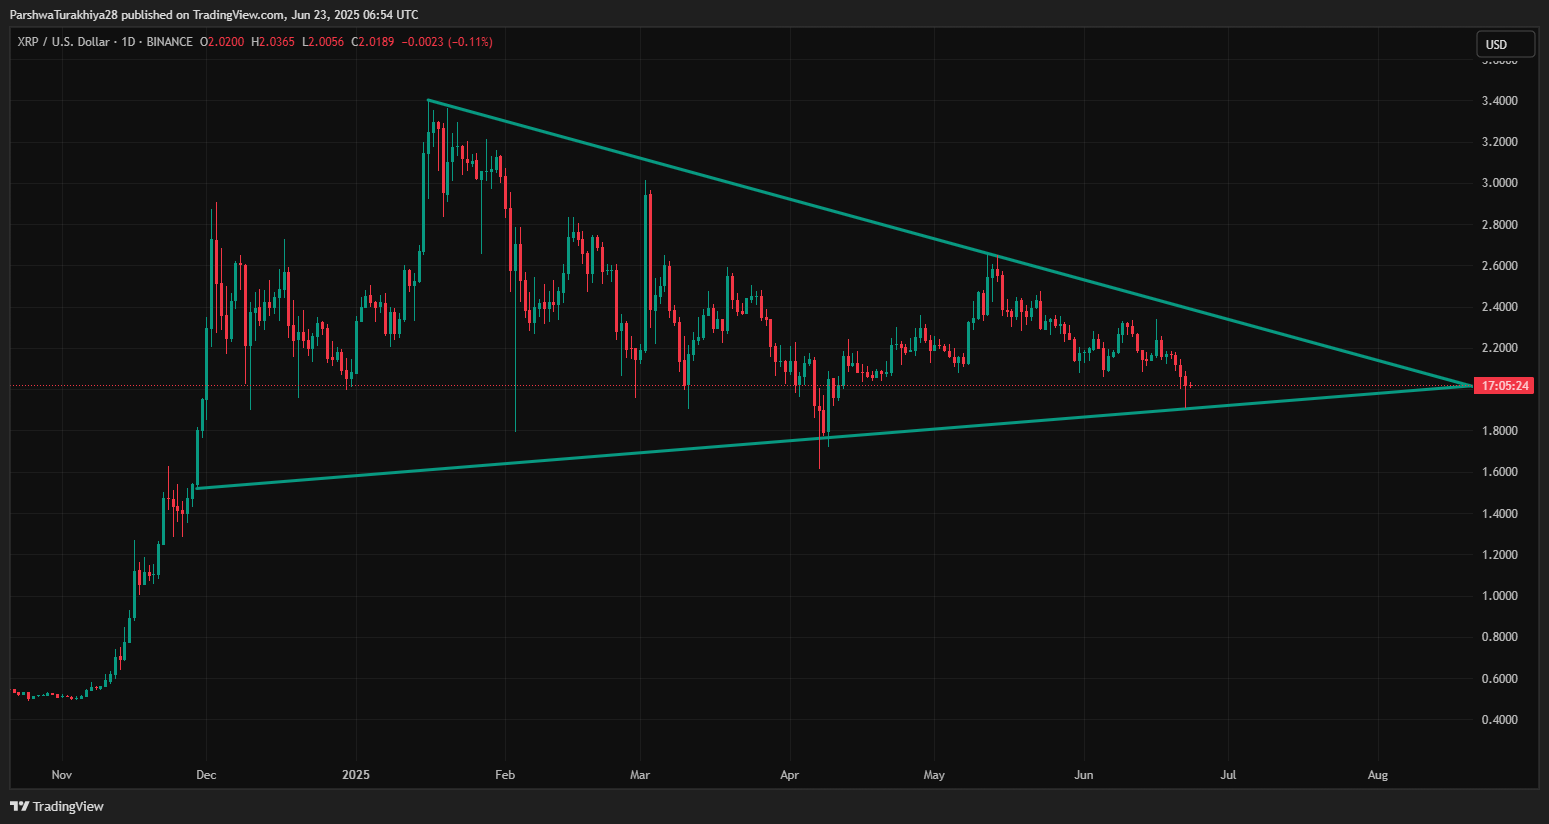

On the daily chart, XRP has officially broken down from a symmetrical triangle, a pattern that began forming in late December 2024. The recent candle close below the ascending trendline marks the first major invalidation of bullish structure since XRP’s $0.70 breakout. Unless buyers reclaim the $2.08–$2.10 range soon, the price could rotate toward the next support at $1.94, followed by $1.88.
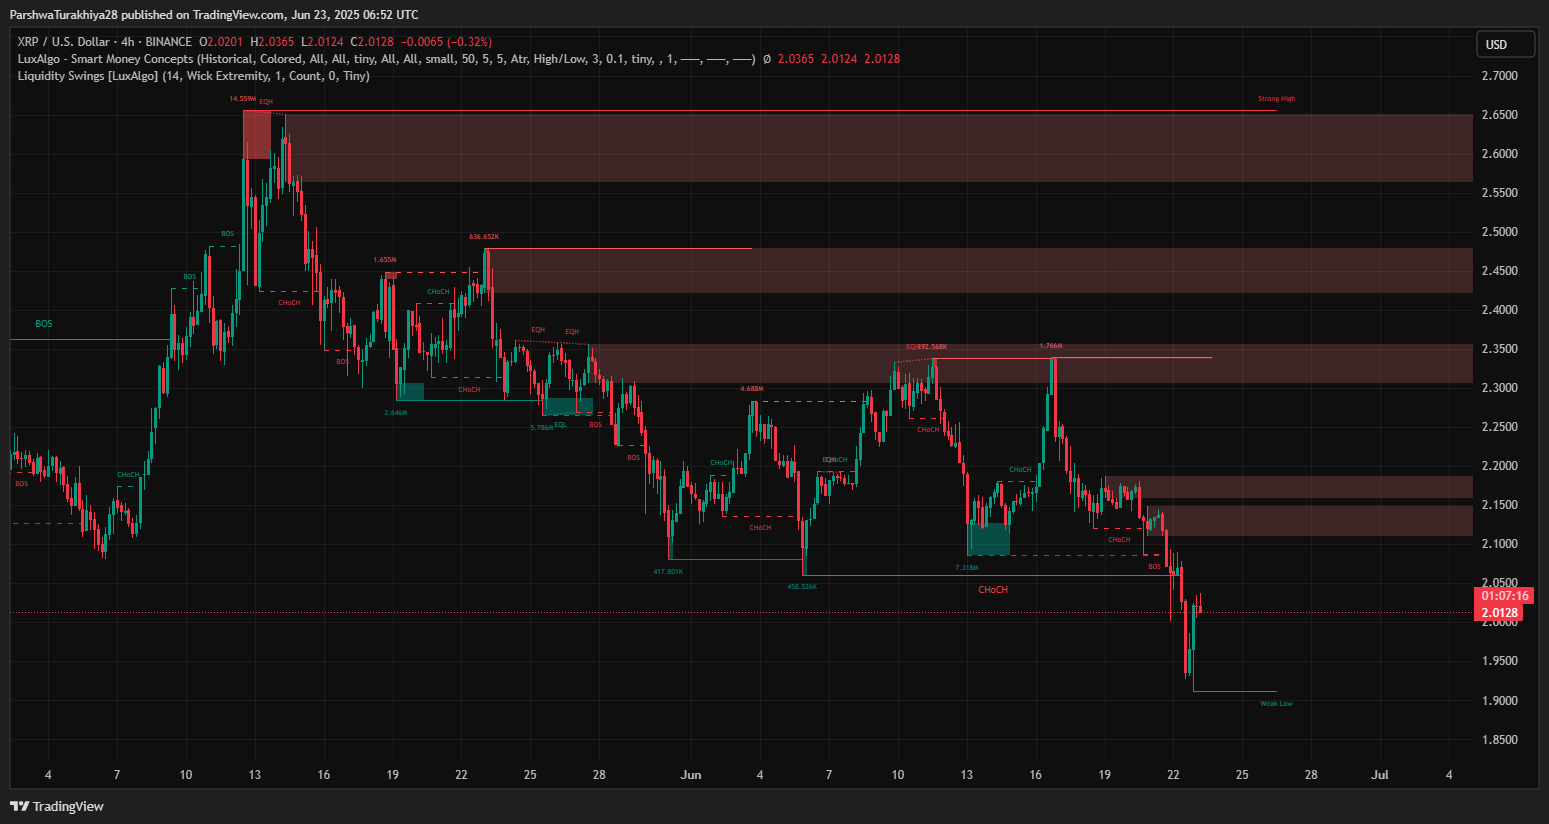
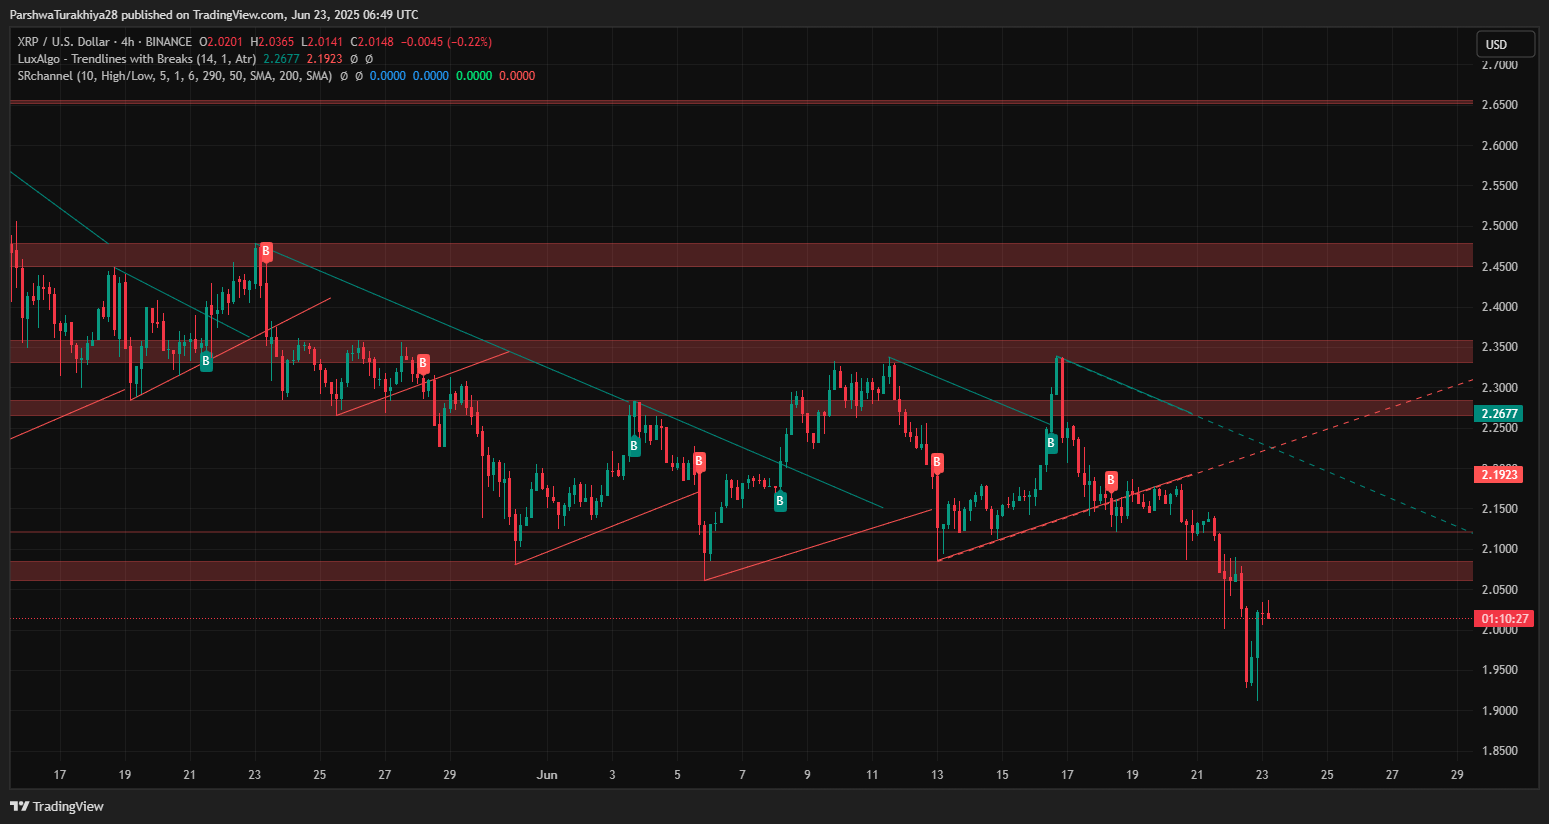
Meanwhile, the XRP price action on the 4-hour chart reveals a significant bearish change of character (CHoCH) after a failed attempt to reclaim the $2.34 liquidity zone. Following this, a sharp break of structure (BOS) confirmed a new lower low, while a “weak low” near $1.92 was marked as vulnerable. Multiple internal CHoCH and BOS events between June 18 and June 22 support this downside scenario. The Smart Money indicator data also shows multiple unmitigated supply zones between $2.15 and $2.22, which are now acting as rejection areas.
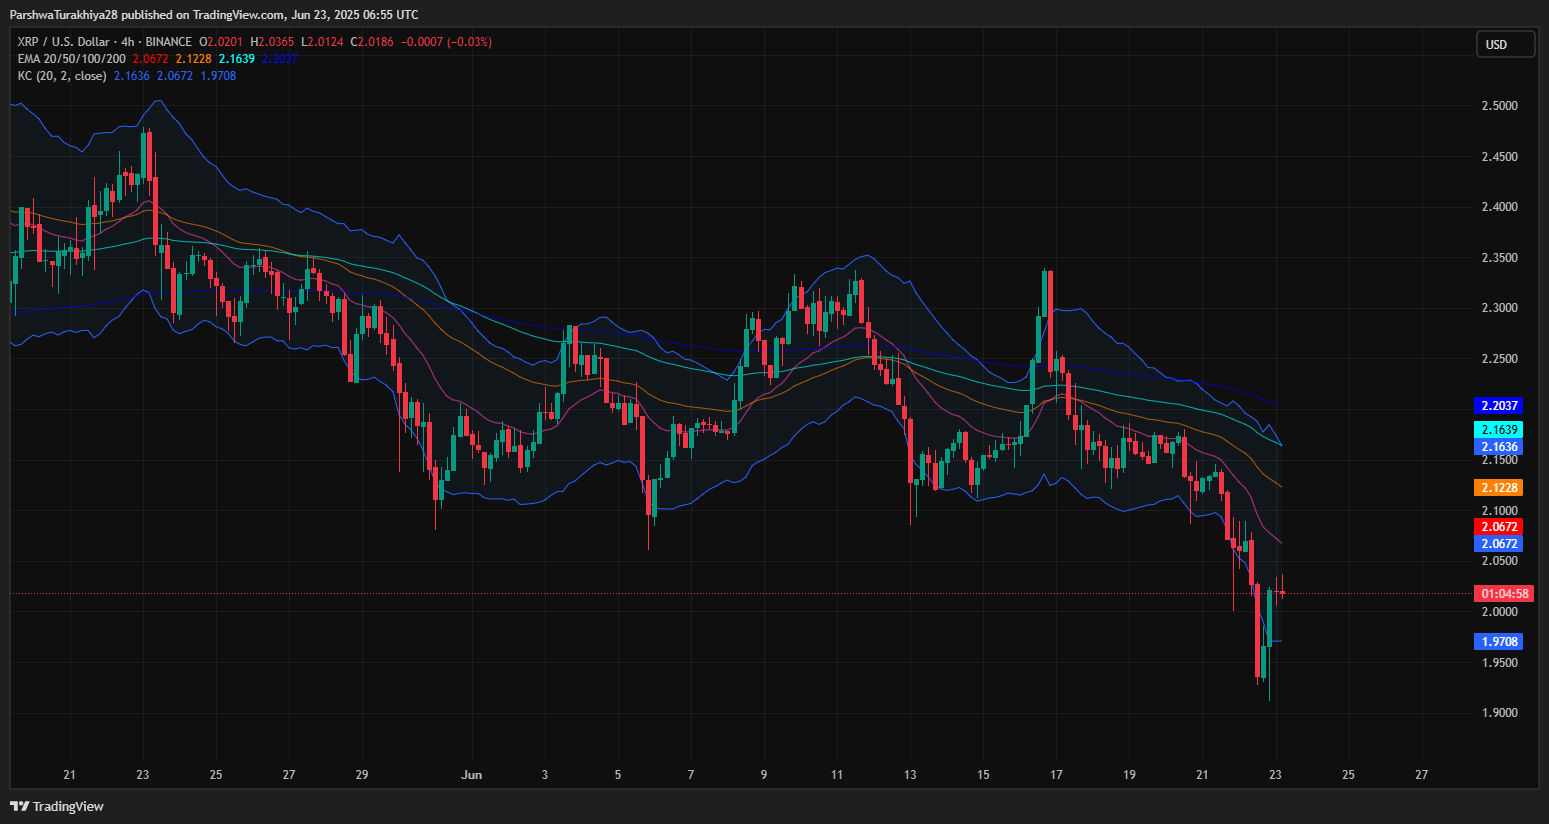
On the 4-hour chart, XRP price action shows the token hovering just below the 20 and 50 EMA cluster. The EMA 20 at $2.057 and EMA 50 at $2.123 are acting as dynamic resistance, while price is struggling to hold support near $2.00. The current XRP price stands at approximately $2.018.
A recent rejection from the mid-band of the Keltner Channel ($2.06) adds pressure, while the lower band at $1.97 continues to act as near-term support. The 4H Supertrend indicator has flipped bearish since June 22 and remains active unless XRP can close back above $2.098 with strong volume.
From a structural perspective, XRP price volatility has compressed over the past two days, with volume tapering near the VWAP. This is reflected on the 30-minute chart, where XRP is currently consolidating around the VWAP range of $2.02–$2.025. This zone is acting as an equilibrium point between short-term buyers and sellers.
XRP Price Prediction: Momentum Mixed As Indicators Signal Pause in Trend
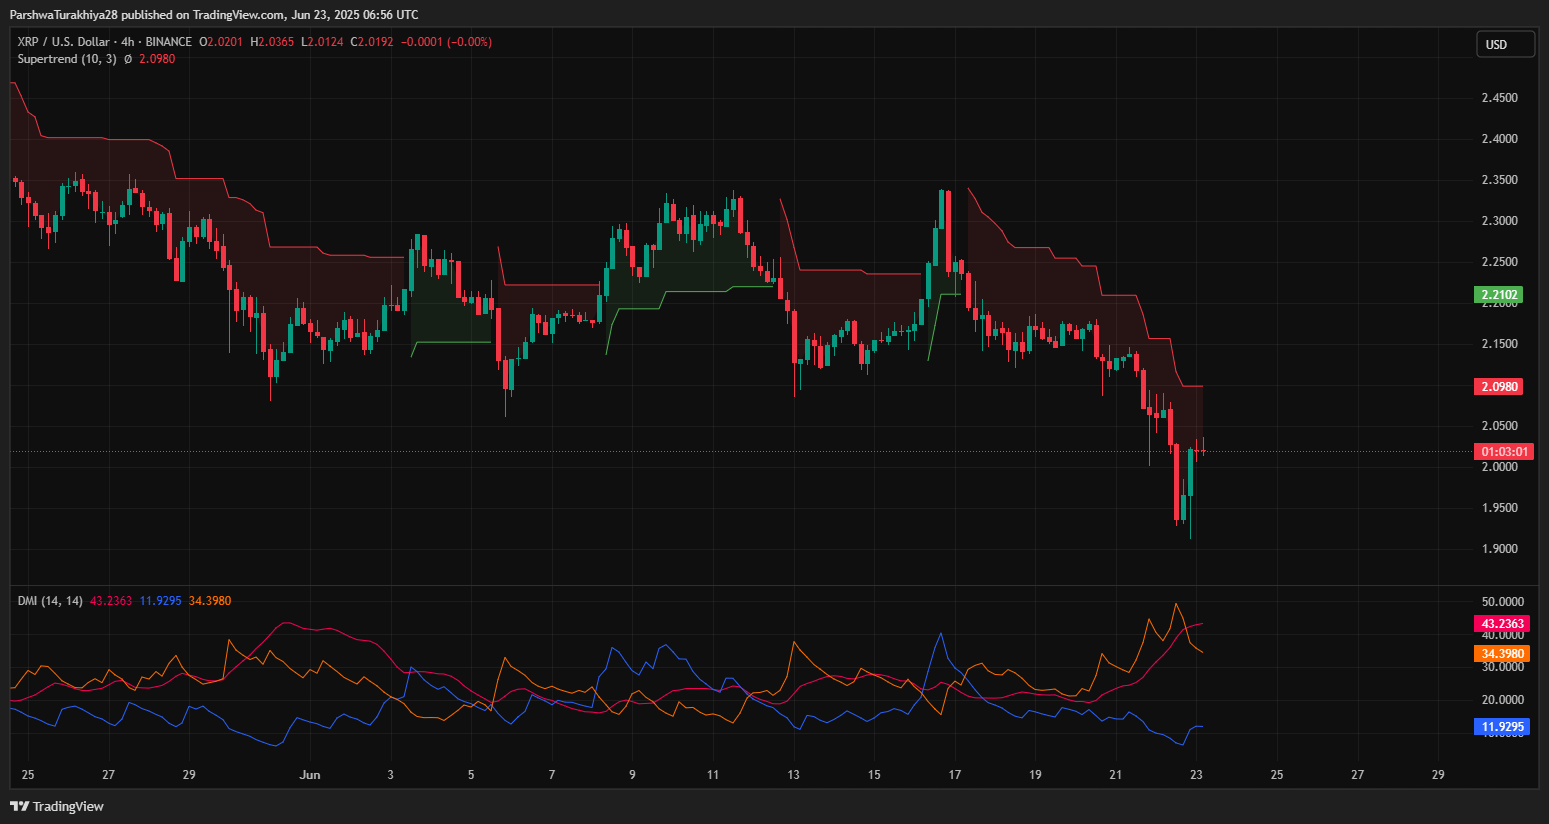
Momentum signals across intraday and 4H timeframes suggest a mixed bias. The 4-hour Directional Movement Index (DMI) highlights bear control, with -DI at 43.2 versus +DI at 11.9. However, the ADX sits at 24.4 — a level indicating trend weakness and suggesting any breakdown could lack immediate follow-through.
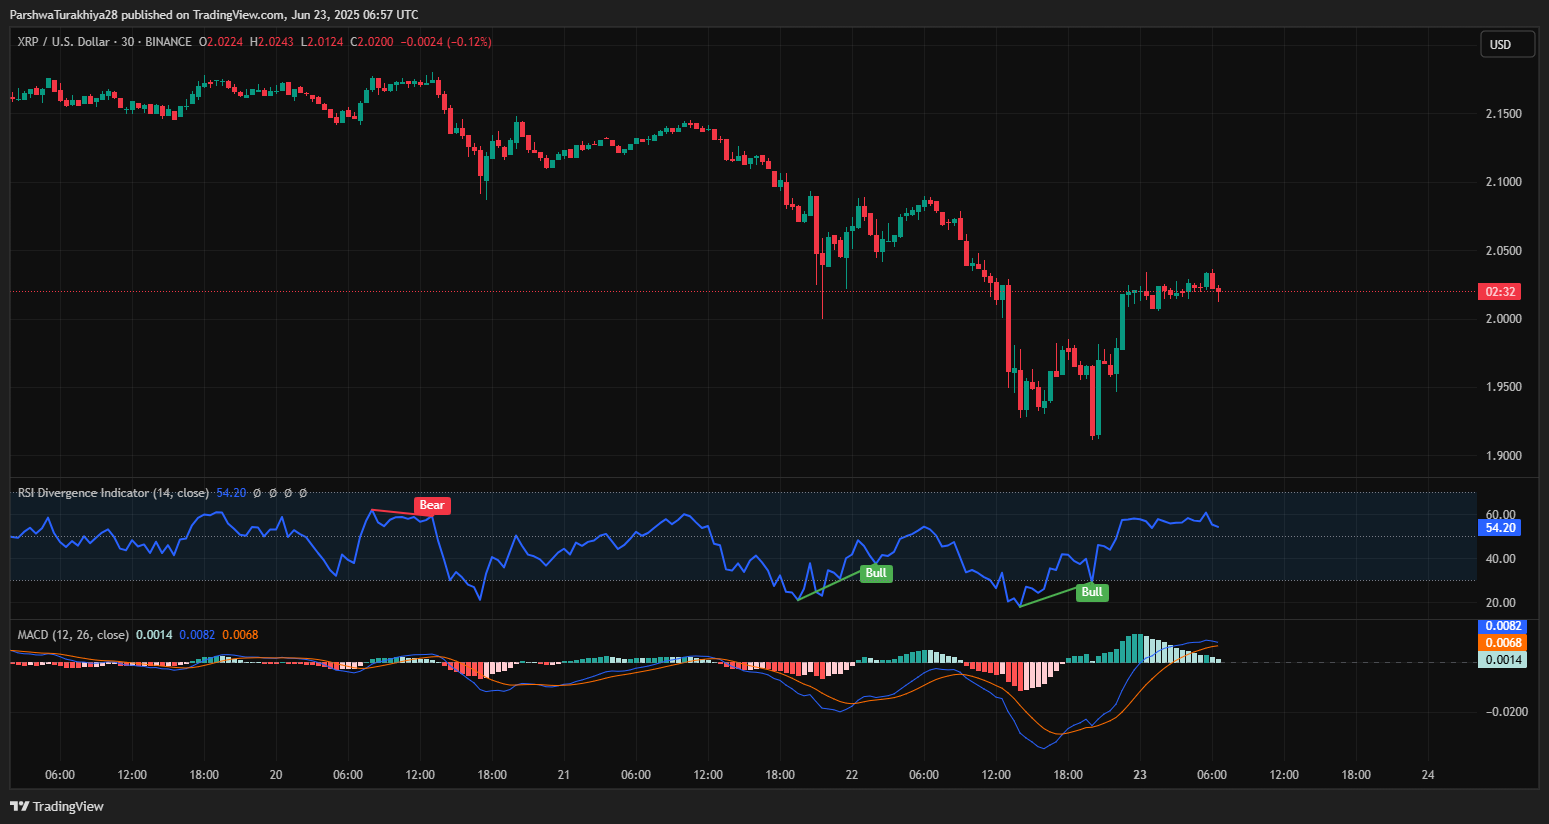
The MACD histogram on the 30-minute chart remains flat, reflecting indecision, while the crossover has failed to deliver follow-up momentum. Meanwhile, the RSI on 1H and 4H timeframes is hovering near 53–55, showing signs of waning bearish strength. A bullish divergence appears to be forming, which could give bulls a chance to reclaim control if confirmed with volume.
The Parabolic SAR has flipped below the price on the 30-minute chart, supporting the idea of a potential minor rebound — but this remains fragile without a close above $2.05.
Why XRP Price Going Down Today?

The answer to why XRP price going down today lies in the sustained rejection from a confluence of resistance levels. The EMA cluster between $2.05 and $2.16 continues to act as a ceiling, with multiple rejections occurring around $2.12–$2.14 over the past week. Additionally, the VWAP and Keltner midline near $2.06 have added pressure on intraday moves, keeping the price subdued.
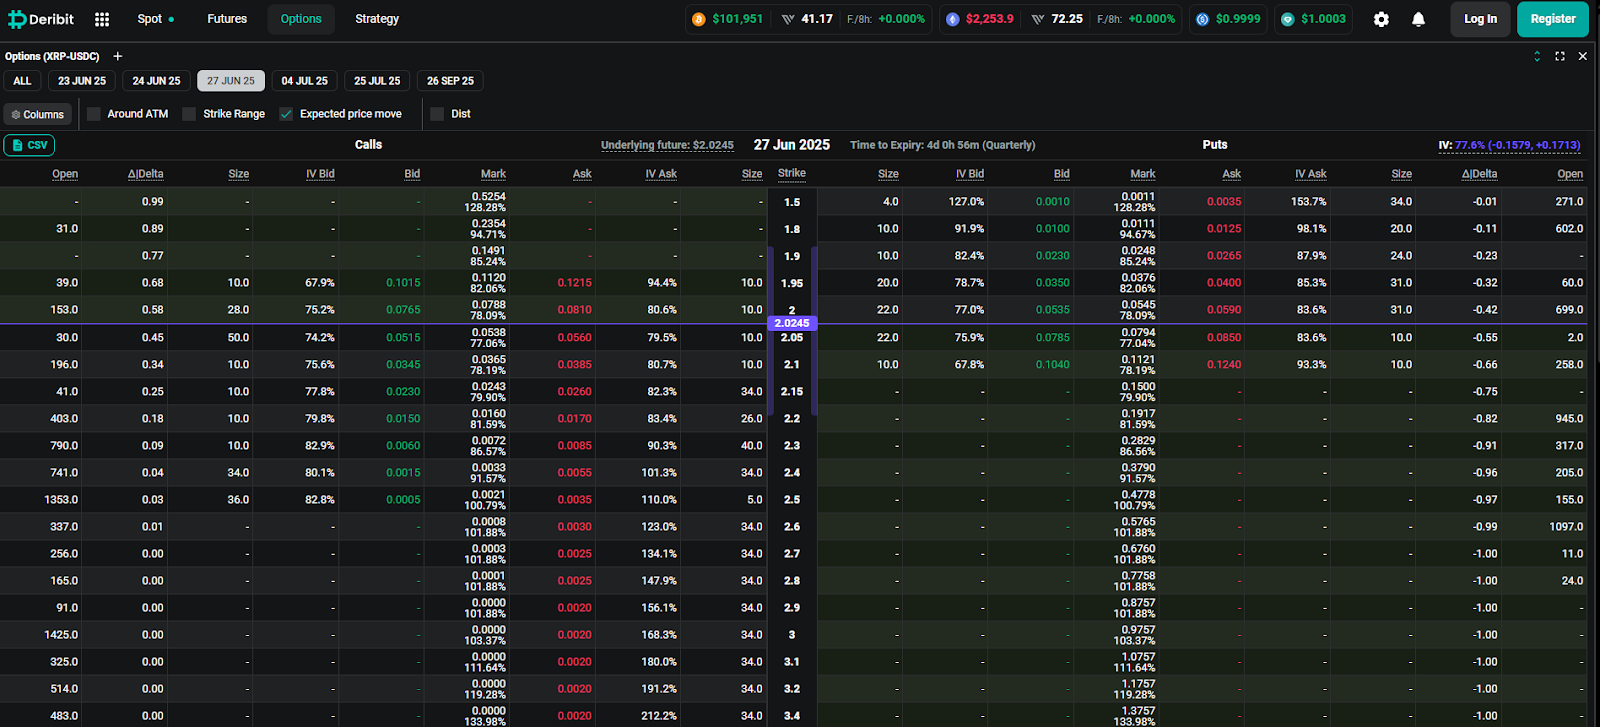
Traders are also pricing in volatility related to the upcoming June 27 options expiry, where implied volatility has climbed to ~75%, adding uncertainty to directional plays. Without strong volume or a breakout above $2.10, the short-term outlook remains capped.
XRP Price Short-Term Outlook: Key Levels to Watch Before Options Expiry
As of June 24, the XRP price update shows a neutral-to-bearish stance as the token fails to reclaim its key moving averages. The bullish case would require a confirmed breakout above the $2.098 Supertrend level, ideally with closing strength above $2.123 (EMA 50). This would open up the path toward $2.16 and potentially $2.22, a zone that previously acted as a liquidity sweep.
On the downside, immediate support rests between $2.00 and $1.97 — the lower boundary of the Keltner Channel. A breakdown below this zone could lead to a test of $1.94 and eventually $1.89, which marks a major liquidity pocket on the daily chart.
With XRP price volatility compressing, a breakout move appears likely in the next 24–48 hours. However, the direction will largely depend on whether bulls can reclaim the mid-band or bears push below the current range support.
XRP Price Technical Forecast Table: June 24, 2025
| Indicator / Level | Signal / Value | Notes |
| XRP price today | $2.018 | Consolidating near VWAP |
| Resistance 1 | $2.098 | 4H Supertrend level |
| Resistance 2 | $2.123 | 50 EMA zone |
| Resistance 3 | $2.160 | Upper Keltner band |
| Support 1 | $2.000 | Psychological round number |
| Support 2 | $1.970 | Keltner lower band |
| Support 3 | $1.940 | Next demand block |
| EMA Cluster (20/50/100) | $2.057 / $2.123 / $2.163 | Price below all three |
| RSI (4H) | 54 | Weak bullish divergence forming |
| MACD (30-min) | Neutral | Lacks strong crossover |
| VWAP Zone | $2.02–$2.025 | Acts as intraday control |
| DMI (4H) | Bearish (-DI leads) | Trend weak with ADX ~24 |
| Parabolic SAR | Flipped Bullish | Below price at $1.998 |
Disclaimer: The information presented in this article is for informational and educational purposes only. The article does not constitute financial advice or advice of any kind. Coin Edition is not responsible for any losses incurred as a result of the utilization of content, products, or services mentioned. Readers are advised to exercise caution before taking any action related to the company.
Source: https://coinedition.com/xrp-price-struggles-near-2-02-as-bulls-fail-to-reclaim-ema-resistance/