After facing a sharp rejection from the $2.32 resistance, the XRP price today has declined toward the $2.14 level, down roughly 0.7% over the last 24 hours. Despite a brief breakout earlier this week, the XRP price has struggled to sustain gains, weighed down by macro outflows and fading volume. With liquidity shrinking and technical indicators deteriorating, bulls are now left defending a vulnerable demand zone near $2.10.
What’s Happening With XRP’s Price?
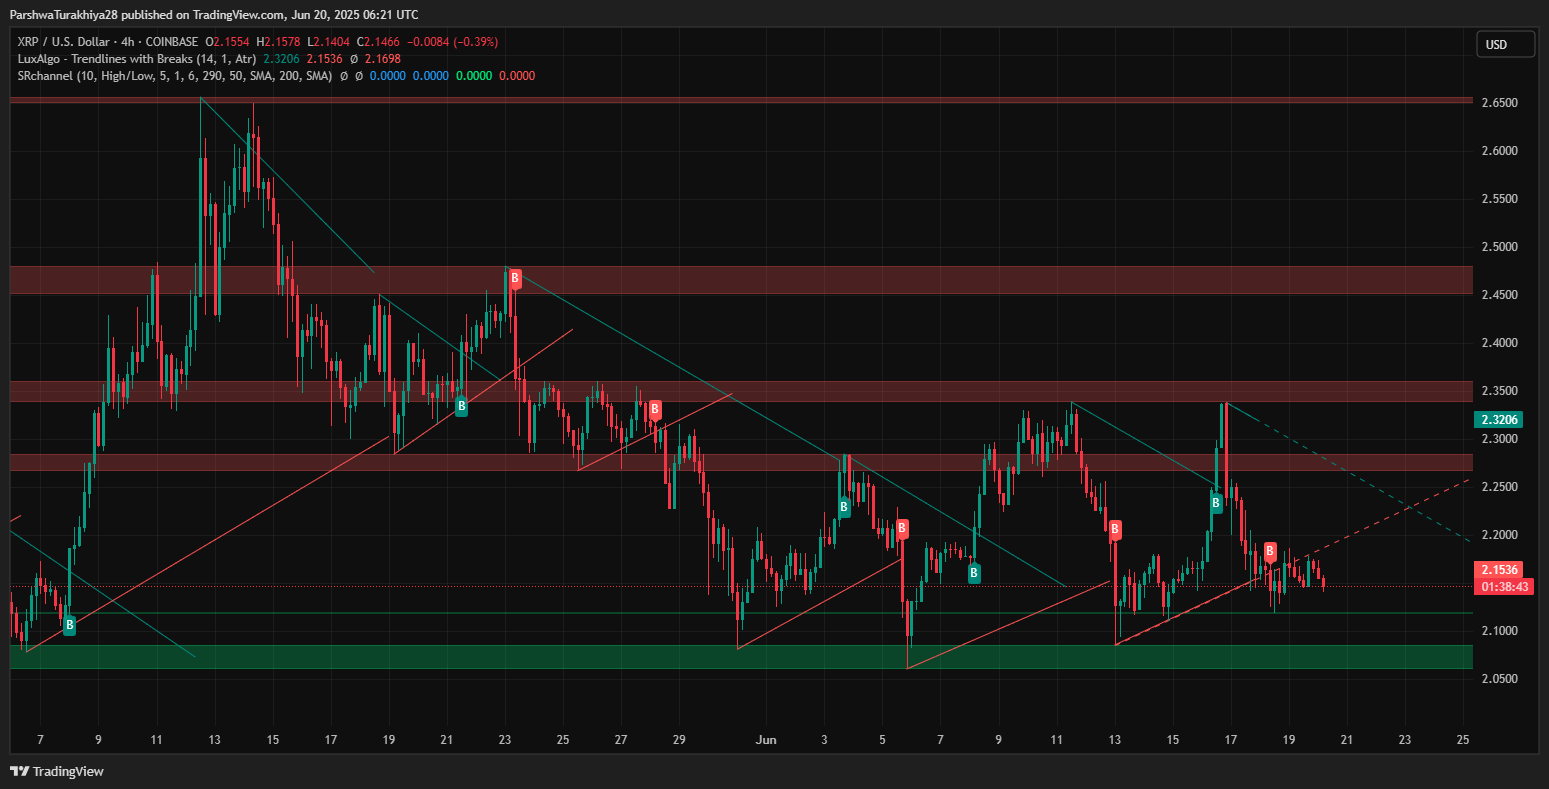

The recent XRP price action suggests growing indecision among traders. The 4-hour chart shows a clear breakdown from the ascending wedge, with the price slipping below the key trendline that had been holding since early June. The market is now trading inside a broad bearish consolidation, testing support at $2.14 after rejecting the $2.32 swing high.
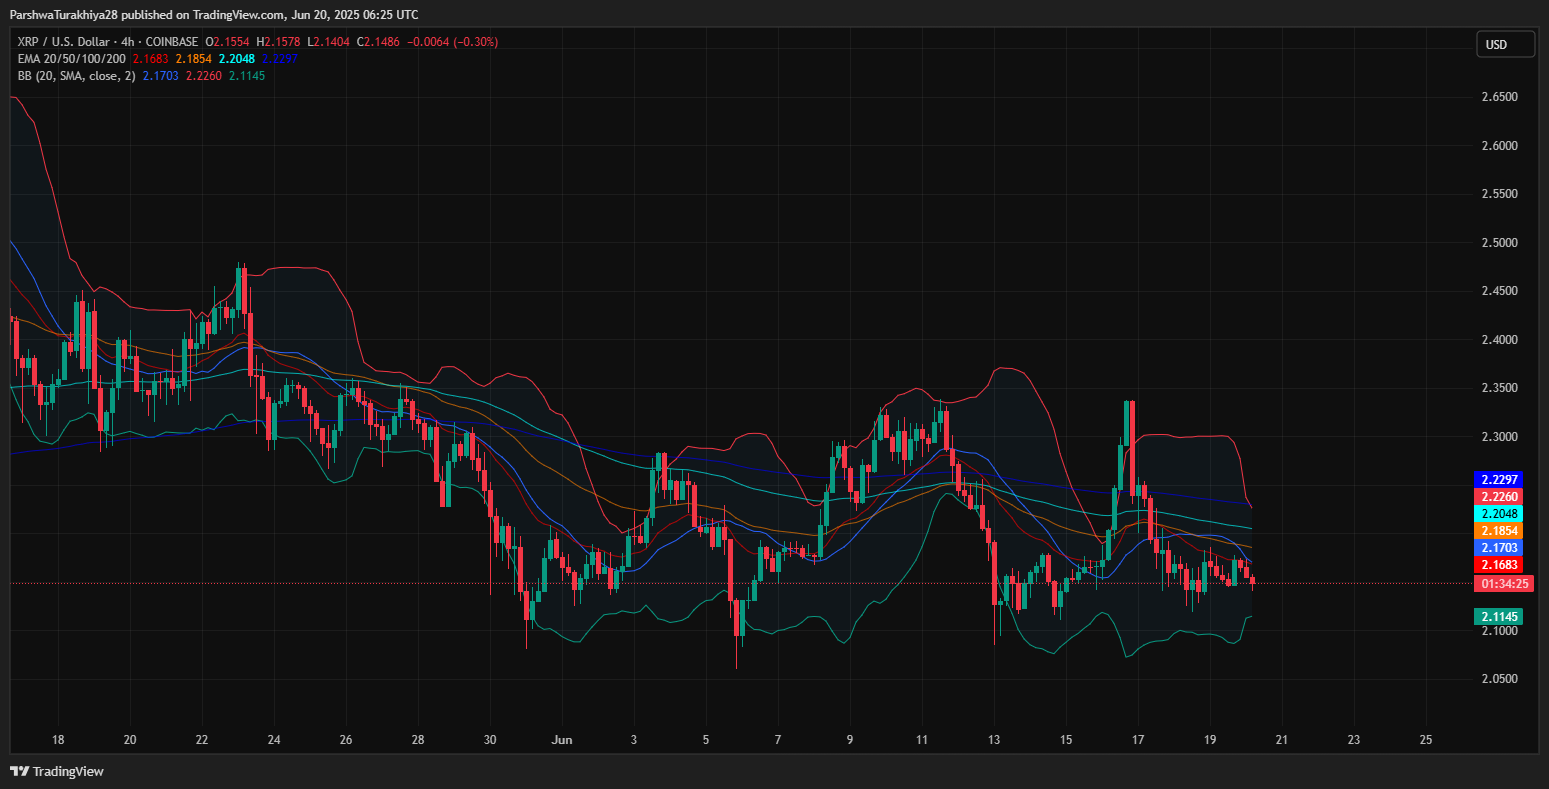
Bollinger Bands are tightening, indicating a likely volatility expansion soon. However, the squeeze is happening below all major EMAs—20, 50, 100, and 200—currently clustering between $2.17 and $2.23. This reinforces the bearish structure, especially as price remains beneath the midpoint of the Bollinger Bands at $2.1683.

The daily symmetrical triangle pattern also adds to the caution. Price is compressing toward the apex of this long-term structure, with both the lower and upper trendlines converging around the $2.14–$2.18 zone. This setup often precedes a major move, and momentum indicators are hinting at a potential breakdown.
Why is the XRP Price Going Down Today?
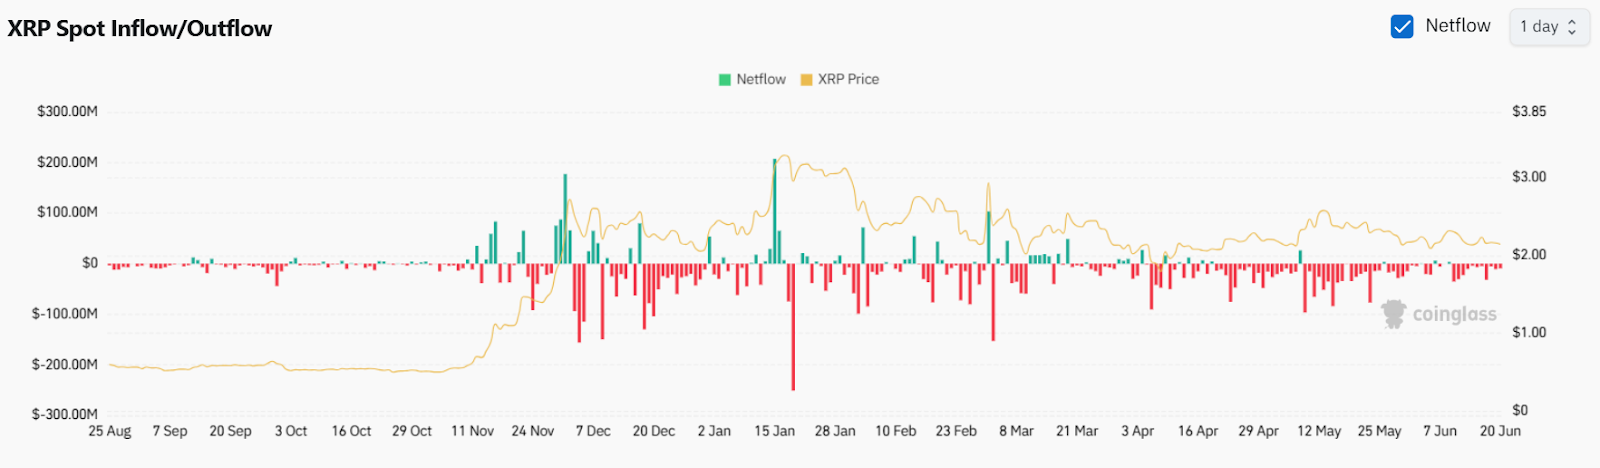
The question of why XRP price going down today can be addressed by examining recent exchange flows and chart structure. Data from CoinGlass shows that XRP has experienced consistent negative netflows over the past four sessions, totaling over $56 million. Outflows peaked on June 17 at $31.85 million, followed by -$5.48 million on June 18, -$10.67 million on June 19, and -$9.03 million on June 20. These withdrawals suggest that large holders are moving XRP off exchanges, a common sign of long-term accumulation.
Although sustained outflows often reflect bullish positioning by strategic buyers, XRP price today continues to struggle near short-term resistance. This reflects a cautious market where accumulation is present but not aggressive enough to reverse current momentum.
In short, while exchange outflows imply accumulation, the current XRP price action is still defined by low momentum and short-term bearish structure. A stronger shift in buying volume will be needed to break this pattern.
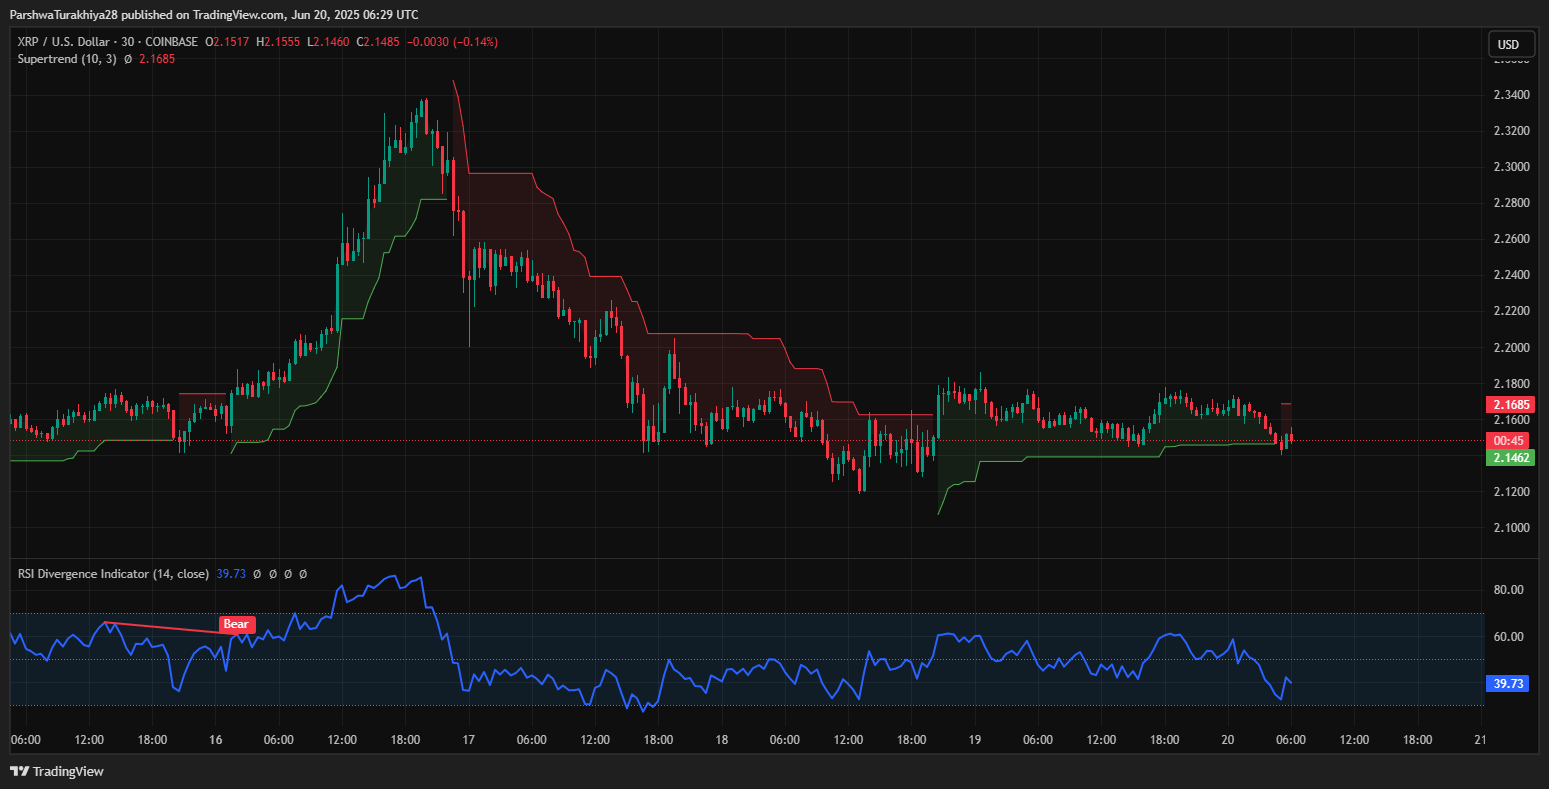
Technical indicators support this view. The 30-minute RSI remains below 40, and MACD is flat, showing a lack of clear upside pressure. Near-term resistance at $2.20 and $2.236 must be reclaimed for any meaningful reversal.
The Supertrend indicator has also flipped to bearish on both the 30-minute and 4-hour timeframes, with resistance forming near $2.1685. This is further supported by the Parabolic SAR, which plots overhead dots—signaling trend exhaustion.
Key Zones and XRP Price Outlook for June 21
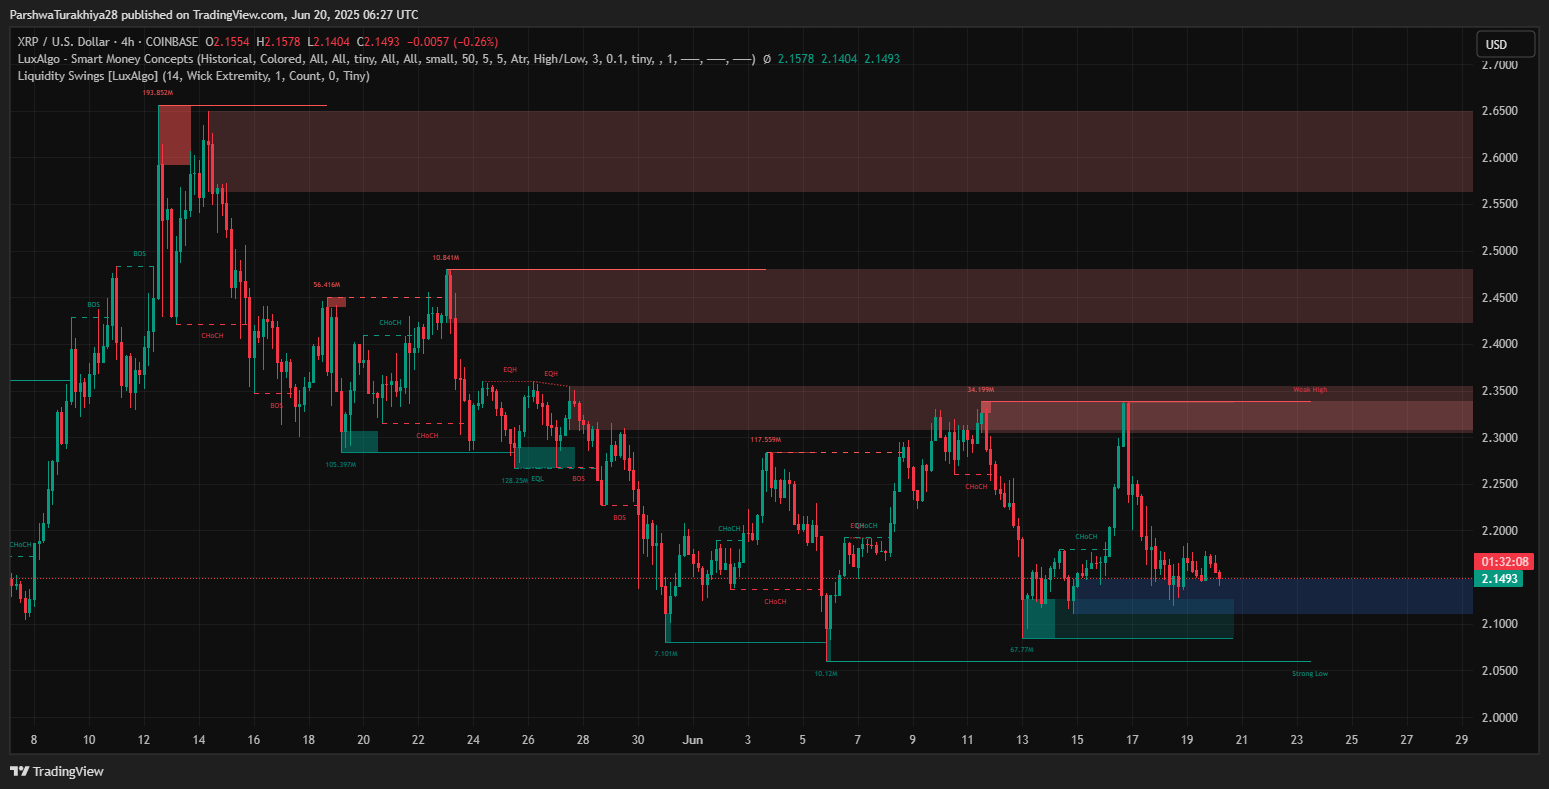
Support is currently being tested at the $2.14–$2.10 zone, a key liquidity block shown in the Smart Money Concepts chart. This area previously acted as a springboard in mid-June but is now under siege. A breakdown below this level could accelerate declines toward $2.02, and in an extended selloff, the strong demand zone near $1.96 may come into play.
On the flip side, if bulls can reclaim $2.17 and close above the EMA cluster, it could open a path back toward $2.23 and $2.32, which marks the upper supply zone. However, the lack of follow-through volume and persistent net outflows suggest this scenario remains less likely unless market sentiment shifts.
The broader structure remains coiled within a long-term triangle, and if XRP breaks below the ascending base, a full reversion to $1.92 or lower could be triggered—aligning with the historical range lows seen earlier this year.
XRP Price Forecast Table: June 21, 2025
| Indicator/Zone | Level (USD) | Signal |
| Resistance 1 | 2.1685 | Supertrend threshold |
| Resistance 2 | 2.2048–2.2297 | EMA 50–200 cluster |
| Resistance 3 | 2.32 | Major supply zone |
| Support 1 | 2.1145 | Lower Bollinger Band |
| Support 2 | 2.02 | Previous reversal level |
| Support 3 | 1.96 | Strong demand zone |
| RSI (30-min) | 39.73 | Bearish momentum |
| Netflow (June 20) | -$9.03M | Sustained outflows |
| Supertrend (4H) | Bearish | Downside trend bias |
| Bollinger Band Squeeze | Active | Impending volatility |
| Price Structure | Sym. Triangle | Coiling for breakout |
Disclaimer: The information presented in this article is for informational and educational purposes only. The article does not constitute financial advice or advice of any kind. Coin Edition is not responsible for any losses incurred as a result of the utilization of content, products, or services mentioned. Readers are advised to exercise caution before taking any action related to the company.
Source: https://coinedition.com/xrp-price-prediction-for-june-21-2025/