After days of tight consolidation, the Sei price today has exploded upward to $0.286, marking a more than 17% daily gain. This move comes as SEI breaks out from a prolonged accumulation range, reclaiming key support zones and invalidating prior bearish structures.

With liquidity swept below $0.17 earlier in the month and Smart Money signals flipping bullish, the current Sei price action suggests potential for further upside—but the next move hinges on how price reacts near immediate resistance at $0.30.
What’s Happening With Sei’s Price?
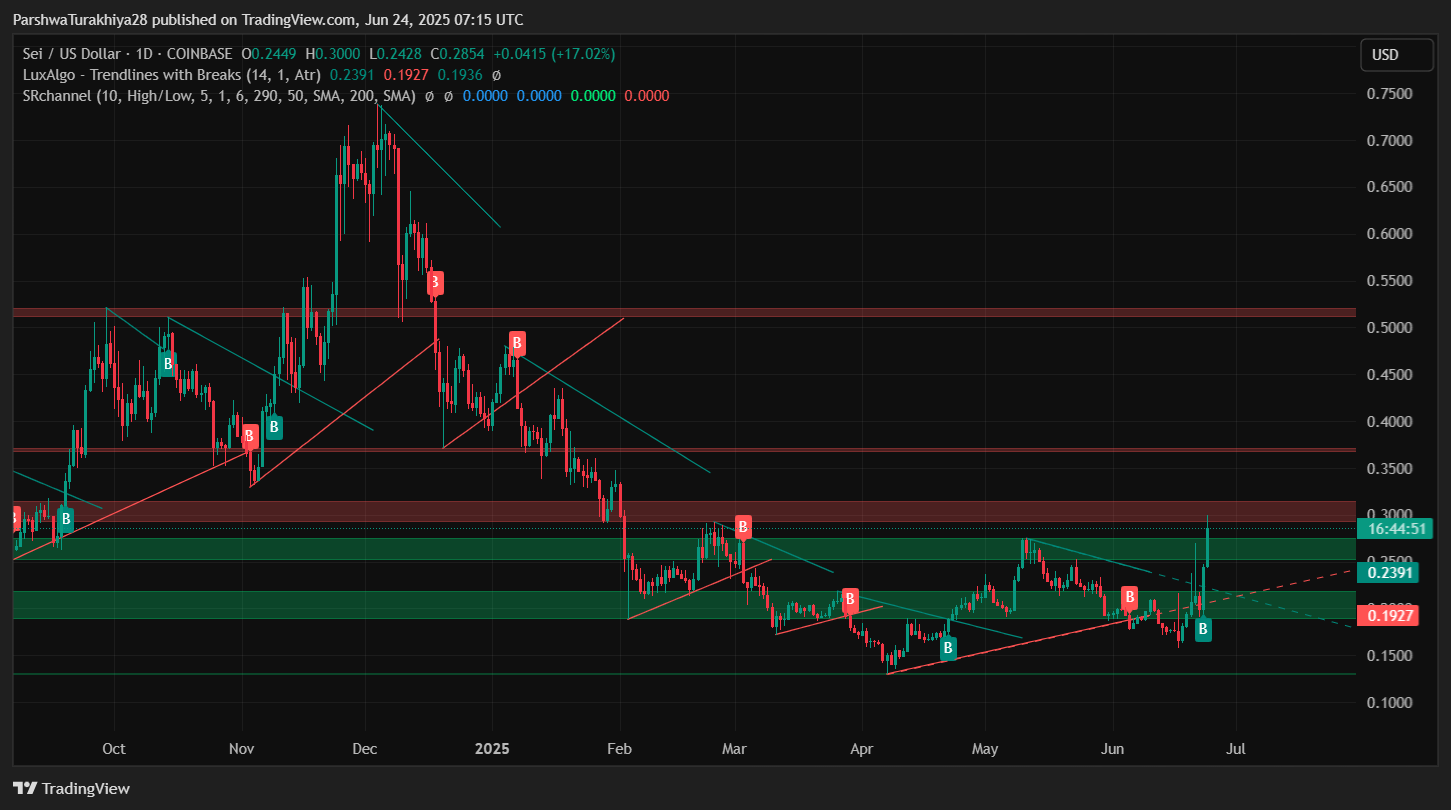
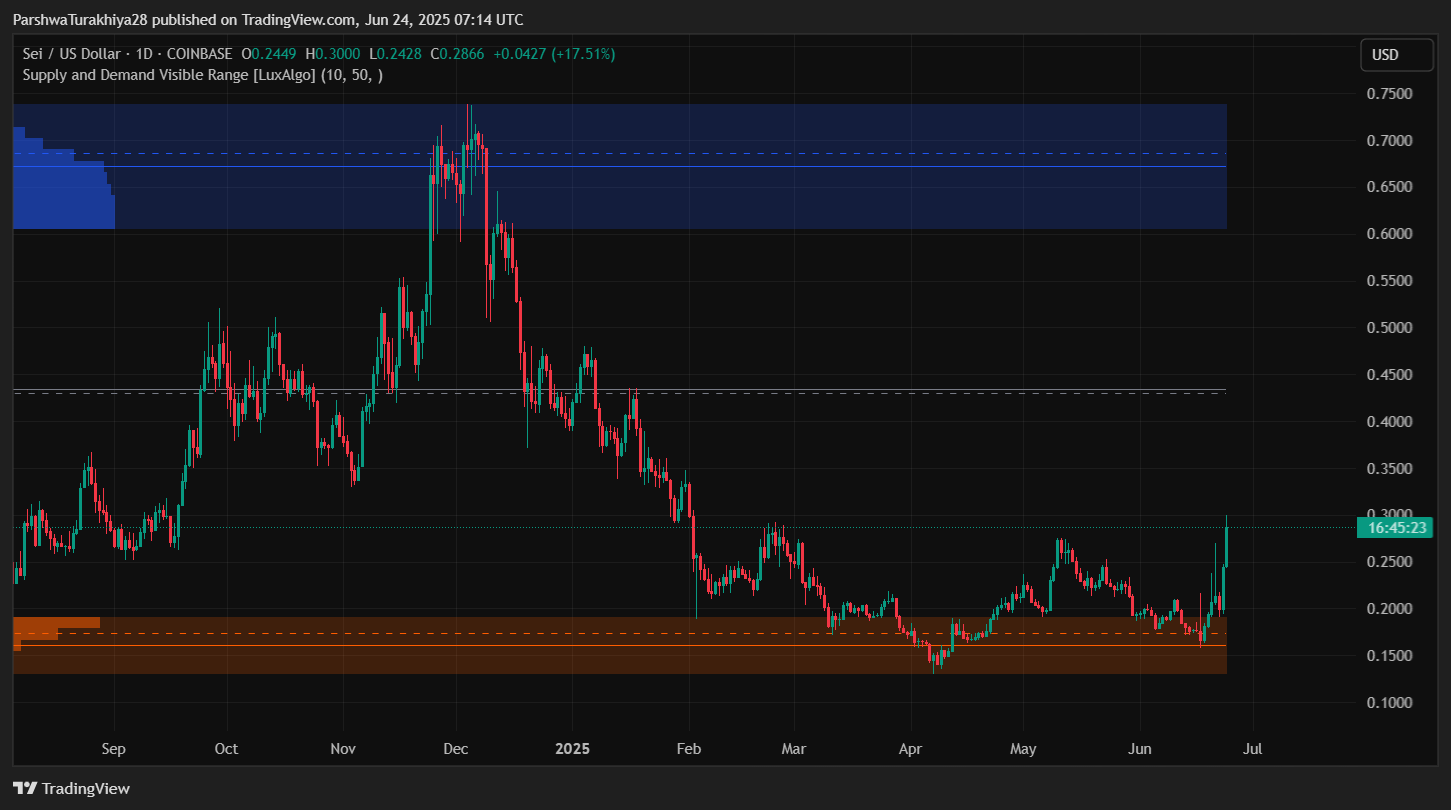
The current breakout finds origin in the lower demand zone around $0.17–$0.19, which previously held as a macro accumulation base. A clear break of structure (BOS) on both the daily and 4-hour charts initiated the rally, with SEI now trading inside a mid-range resistance area between $0.28 and $0.30.
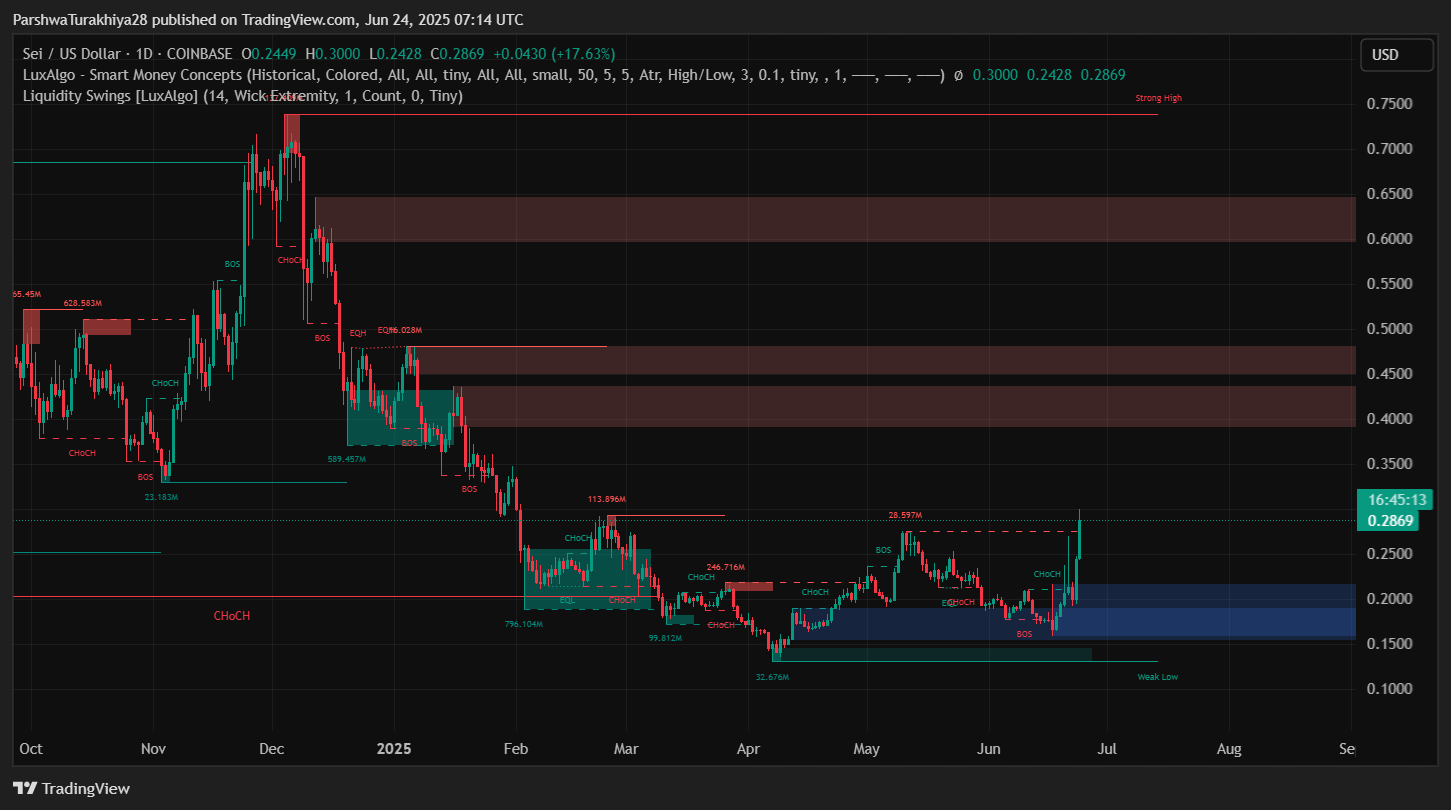
Volume-led expansion is visible on multiple charts, particularly the Smart Money Concept chart, where BOS and CHoCH flips confirm bullish order flow. SEI has also left behind an inefficiency gap near $0.21–$0.23, which may serve as a retest zone if the price cools.
Sei Price Short-Term Indicators Suggest Overheating Amid Bullish Bias
On the 4-hour and 30-minute charts, SEI shows aggressive upside expansion with multiple breakouts of structure and resistance flips. highlights a textbook ascending triangle breakout, with price slicing through prior supply clusters.
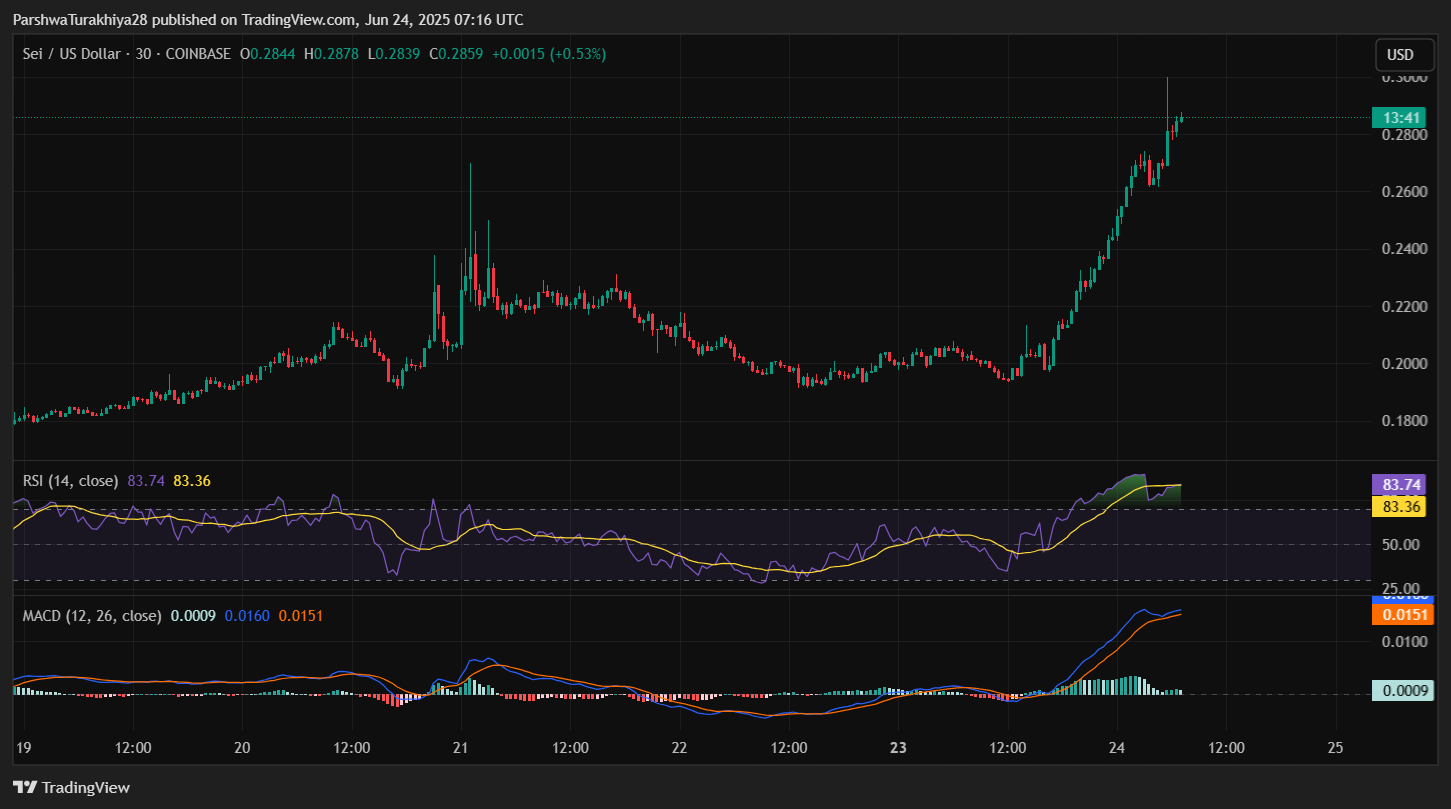
Meanwhile, the RSI on the 30-minute chart has reached 83, firmly in the overbought zone, while the MACD remains elevated but is showing signs of narrowing momentum, implying that Sei price volatility could compress before the next leg.
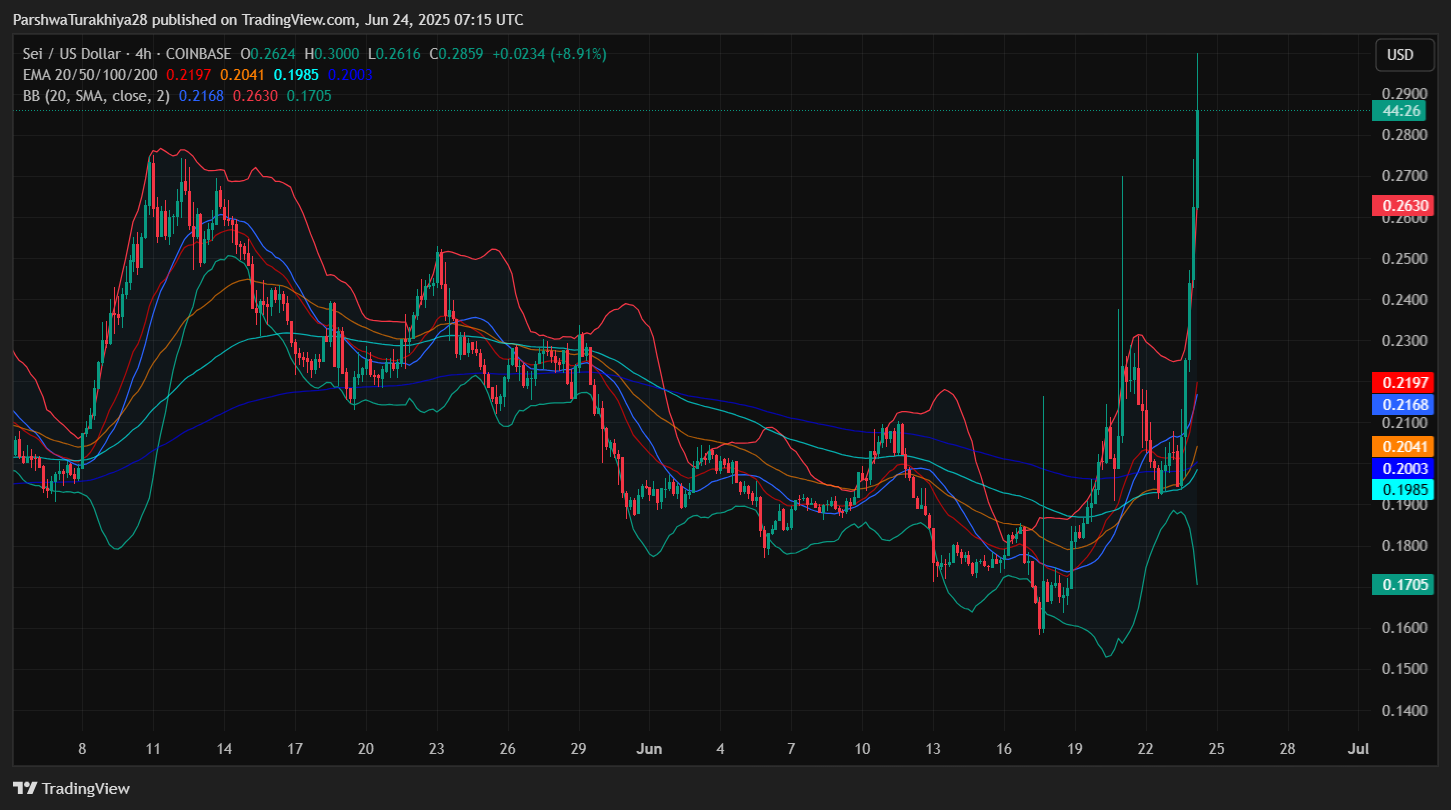
Bollinger Bands on the 4-hour chart show a dramatic expansion, with price pushing the upper band at $0.30. The current Sei price spikes are consistent with breakout exhaustion zones, especially with BBP and ADR readings elevated.
Why Sei Price Going Up Today?
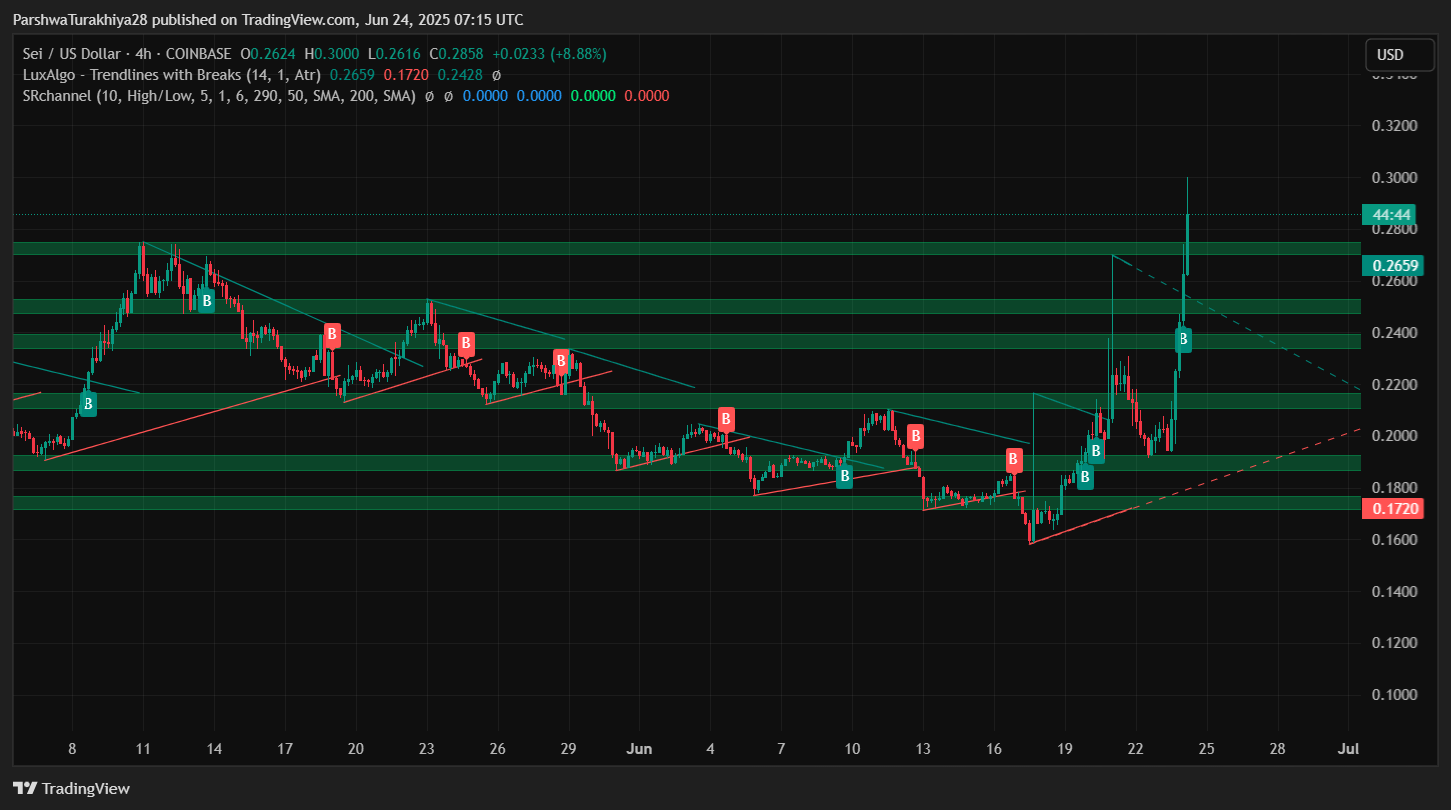
The rally in SEI appears to be driven by structural breakout confirmations across daily and intraday timeframes. On the 4-hour chart, a falling wedge structure broke cleanly to the upside, followed by a volume-backed rally past multiple resistance levels including $0.218, $0.242, and $0.265.
Moreover, Smart Money indicators show liquidity sweeps at weak lows and clear BOS markers from earlier this week, supporting a bullish market regime. The reclaim of the midpoint level near $0.256 and push into the upper resistance band confirms buyers are aggressively re-entering, especially as Sei price today trades near R5 levels of the Fibonacci pivot ($0.2864).
Can SEI Price Extend Above $0.30 or Will a Pullback Follow?
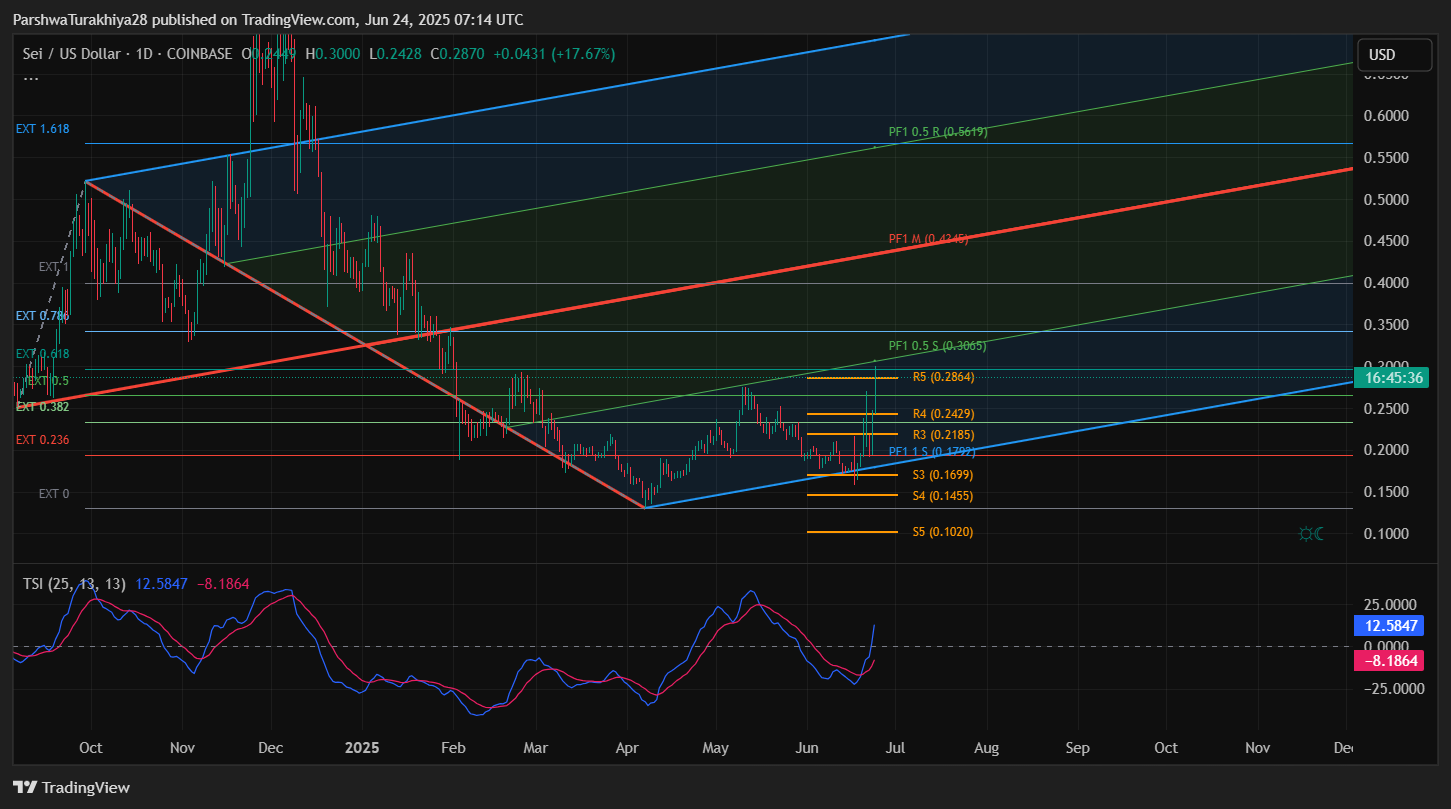
Looking ahead, $0.30 stands as the next psychological barrier and the top of the current rally extension. A break and close above this level with volume could open the path toward the upper Fibonacci pivot near $0.3065 and potentially toward the long-term trendline resistance at $0.3610.
However, with RSI in extreme territory and MACD losing upward slope on the lower timeframe, a short-term pullback remains possible. If SEI fails to hold $0.272–$0.265, the price may retrace toward $0.2429 or even $0.2185 to fill inefficiency and retest broken structure.
Sei Price Forecast Table: June 25
| Indicator/Zone | Level (USD) | Signal |
| Sei price today | $0.2859 | Breakout active |
| Resistance 1 | $0.30 | Psychological/BB upper band |
| Resistance 2 | $0.3065 | Fibonacci R5 |
| Support 1 | $0.2659 | Minor pullback zone |
| Support 2 | $0.2429 | Demand retest + inefficiency |
| RSI (30-min) | 83.7 | Overbought |
| MACD (30-min) | Weakening slope | Slowing bullish momentum |
| Bollinger Bands (4H) | Expanding | High volatility |
| Smart Money BOS/CHoCH | Bullish structure | Momentum favoring upside |
The current Sei price update confirms that momentum is strongly in favor of the bulls. However, overbought signals are starting to flash caution. Traders should watch for consolidation or retest around $0.265 before expecting a continuation above $0.30. A failure to hold $0.2429 could invite deeper correction toward the $0.21–$0.22 zone.
Disclaimer: The information presented in this article is for informational and educational purposes only. The article does not constitute financial advice or advice of any kind. Coin Edition is not responsible for any losses incurred as a result of the utilization of content, products, or services mentioned. Readers are advised to exercise caution before taking any action related to the company.
Source: https://coinedition.com/sei-price-prediction-june-25-2025-why-sei-price-going-up-today/