- VeChain faces strong resistance near $0.0201 despite recent recovery momentum.
- Open interest growth signals renewed trader confidence and potential volatility ahead.
- On-chain data shows cautious accumulation as inflows slightly exceed outflows.
VeChain’s price action remains in focus as it recovers from a recent market-wide sell-off. The token rebounded sharply from the $0.0100 low, but upward momentum has been contained beneath major Fibonacci and moving average resistance zones. Despite the temporary bounce, traders remain cautious as technical signals point to indecision across shorter time frames.
Market Recovery Meets Strong Resistance
After recovering from the $0.0100 capitulation zone, VeChain briefly touched $0.0201, aligning with the 61.8% Fibonacci retracement of the decline from $0.0263 to $0.0100. This level has since become a major resistance point.
Sellers repeatedly defended this zone, pushing the token back toward the 50% retracement at $0.0181. A sustained close above $0.0201 would be a bullish confirmation, suggesting renewed buying momentum and a potential test of the $0.0228 zone.
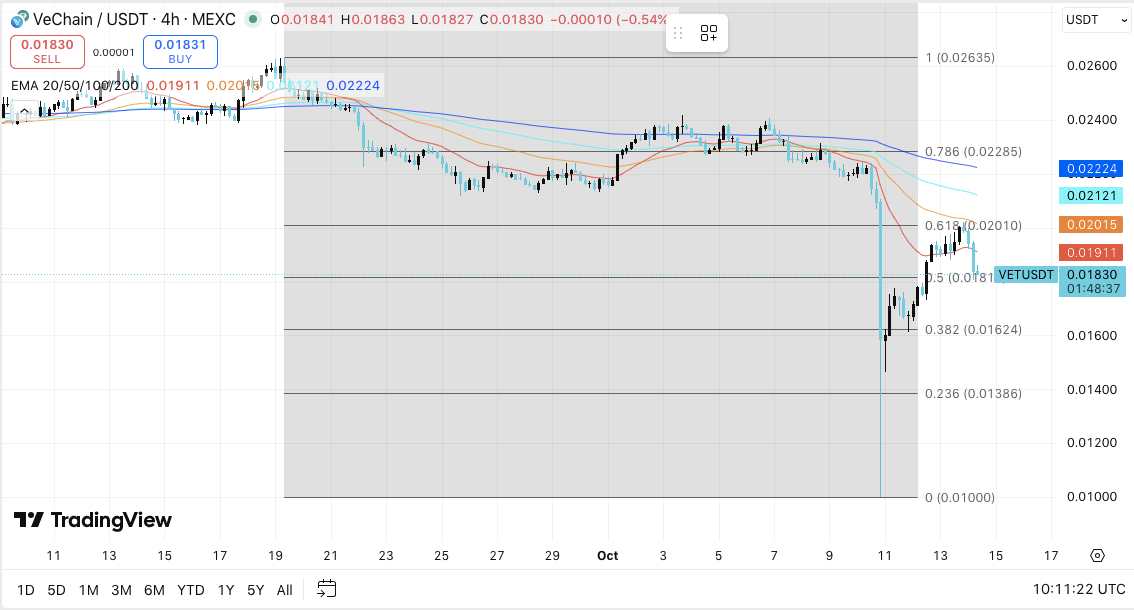

However, the presence of multiple moving averages between $0.0191 and $0.0222 continues to suppress bullish attempts. The 20-EMA lags below the 50 and 100-EMA, indicating lingering downward pressure.
Related: XRP Price Prediction: CME Launches XRP Options And Outflows Deepen
If bulls regain strength above $0.0212, VeChain could target the $0.0263 swing high, completing a short-term bullish reversal. Conversely, a rejection near the EMA cluster could confirm the continuation of the downtrend.
Short-Term Support and Technical Structure
Immediate support sits around $0.0181, marking the midpoint of the current retracement range. A breakdown below this level may trigger a deeper retest toward $0.0162 and $0.0138 areas that coincide with historical consolidation zones. The $0.0100 level remains the psychological floor, where buyers previously defended the market after a sharp capitulation.
Moreover, the token’s technical pattern shows narrowing price swings, suggesting compression before a possible breakout. Such setups often lead to volatility expansion, depending on market liquidity. Hence, traders are watching for a confirmed breakout beyond $0.0201 or a close below $0.0162 to determine the next directional move.
Open Interest Reflects Renewed Participation
VeChain’s open interest has mirrored its growing trader engagement throughout 2025. It began the year near $47.7 million and surged to more than $150 million by midyear as speculative positioning intensified.
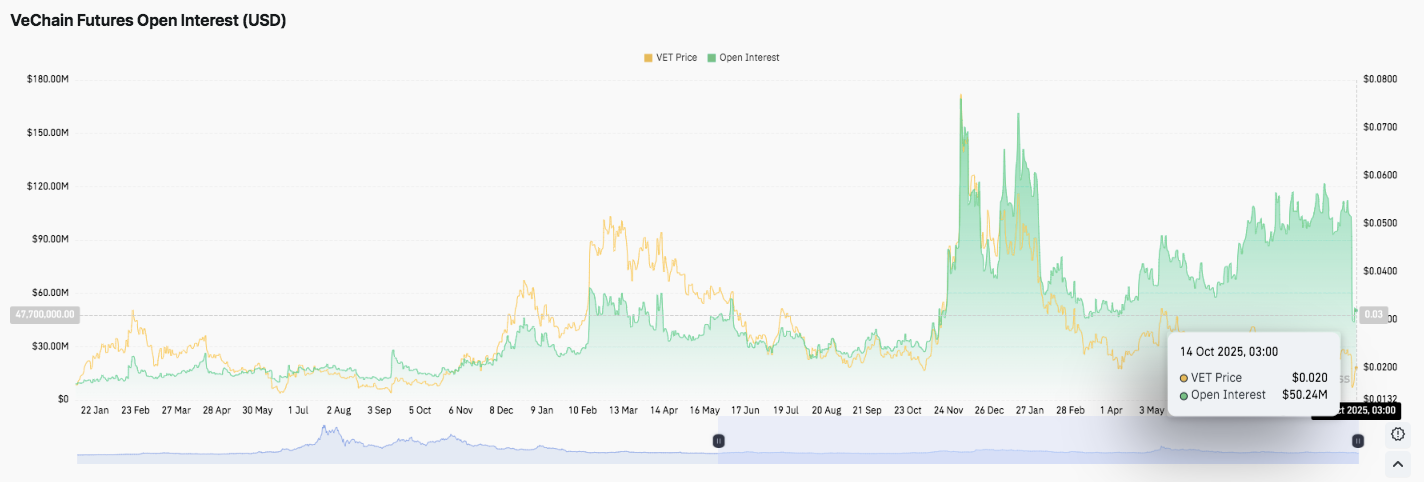

Although recent months saw mild pullbacks, the metric has consistently formed higher lows a sign of renewed optimism. As of October 14, 2025, open interest stands near $50.24 million, underscoring fresh activity following consolidation.
Related: Pi Price Prediction: Pi Struggles for Stability Near $0.21
This stability suggests that derivatives traders are gradually regaining confidence. Sustained open interest alongside moderate price movement often precedes directional volatility, implying that VeChain could experience larger moves once momentum builds.
Inflow and Outflow Patterns Show Cautious Accumulation
On-chain data reveals alternating inflow and outflow patterns, highlighting investor hesitation. Since July, inflows have slightly exceeded outflows, reflecting slow but steady accumulation.
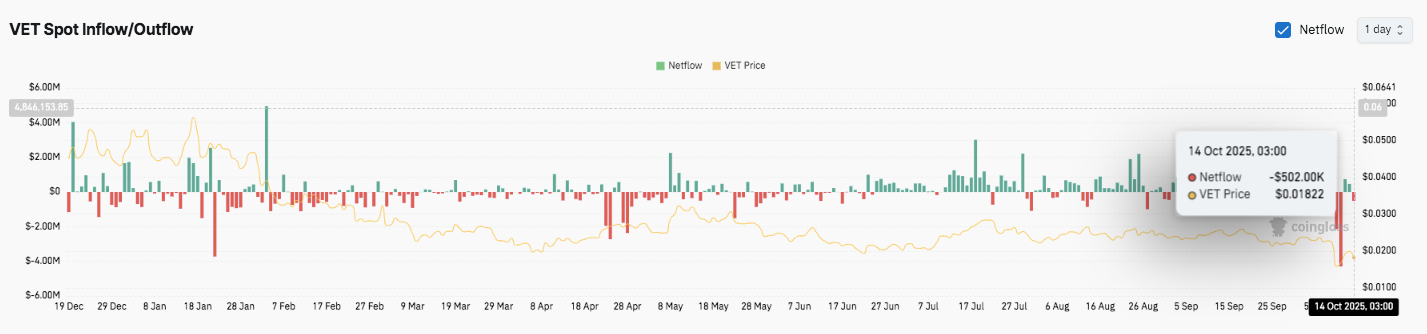

However, the most recent reading on October 14 showed a $502,000 net outflow as VeChain’s price slipped toward $0.01822. The movement indicates short-term profit-taking or reduced demand after a temporary rally.
Historically, significant inflows coincided with upward moves, while outflows preceded brief corrections. Consequently, the current pattern suggests that investors remain defensive, with liquidity cycles closely tracking VeChain’s price fluctuations between $0.02 and $0.06 over the last ten months.
Technical Outlook for VeChain (VET) Price
Key levels remain well-defined heading into mid-October. Upside levels: $0.0201 (61.8% Fibonacci), $0.0212 (100-EMA), and $0.0228 (78.6% Fibonacci) are immediate hurdles. A confirmed breakout above $0.0201 could extend gains toward $0.0245 and $0.0263, the recent swing high.
Downside levels: $0.0181 (50% retracement) serves as initial support, followed by $0.0162 (38.2%) and $0.0138 (23.6%) both aligning with historical consolidation zones. The $0.0100 mark remains a critical psychological floor and previous capitulation low.
The broader chart structure suggests VET is trading within a narrowing channel, reflecting reduced volatility and compressed price action. A decisive breakout in either direction may dictate the next trend cycle.
Will VeChain Sustain Its Recovery?
VeChain’s near-term price outlook hinges on whether bulls can maintain control above $0.0180 and break through the $0.0201 resistance cluster. Sustained momentum could trigger a move toward $0.0228 and $0.0263, confirming a short-term reversal. However, failure to hold above $0.0162 may expose VET to deeper retracement toward $0.0138 or even $0.0100.
Related: Cardano Price Prediction: ADA Price Attempts Recovery but Faces Stiff Resistance
With open interest showing steady recovery and inflows stabilizing, VeChain appears positioned for a potential volatility expansion. Yet, conviction buying above key moving averages remains essential for confirming a bullish shift in market sentiment.
Disclaimer: The information presented in this article is for informational and educational purposes only. The article does not constitute financial advice or advice of any kind. Coin Edition is not responsible for any losses incurred as a result of the utilization of content, products, or services mentioned. Readers are advised to exercise caution before taking any action related to the company.