- VeChain broke key resistance and formed a golden cross, signaling strong bullish momentum.
- RSI was nearing overbought levels, but social volume and MACD support continued upward movement.
VeChain [VET] has recently experienced an impressive price surge, rising by 6.72% and reaching $0.07105, at press time.
This significant upward movement is accompanied by a sharp 35.02% increase in trading volume, signaling heightened market interest.
Given this strong surge, traders, and investors are keen to know if VeChain can maintain its momentum. It’s crucial to analyze technical indicators, social sentiment, and other key factors that may influence VET’s future price movement.
What’s behind the breakout?
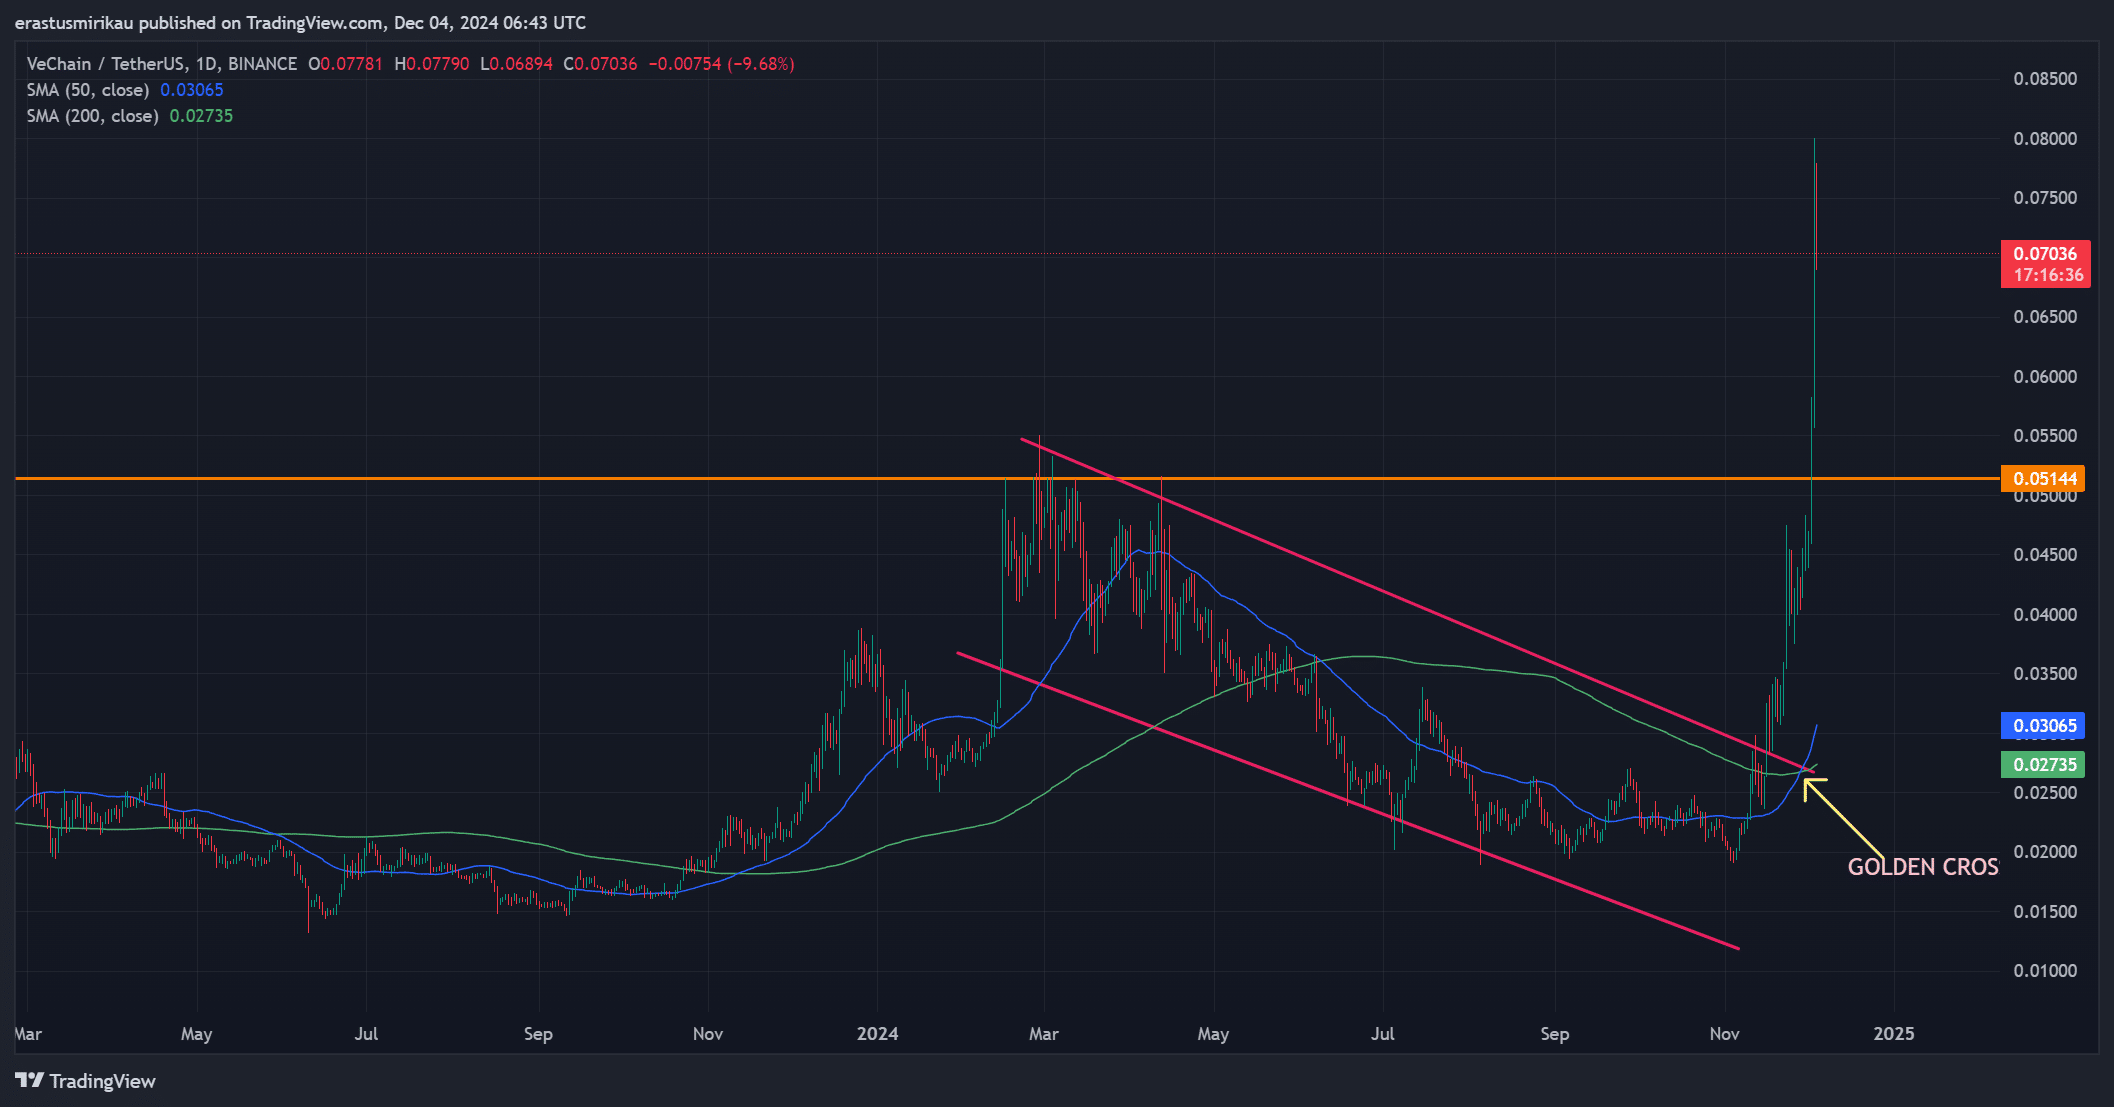
VeChain’s daily chart indicates a breakout from its descending channel, which usually signals a shift in market direction.
Additionally, the formation of a golden cross, where the 50-day Moving Average(MA) crosses above the 200-day MA, strengthens the bullish outlook.
This crossover often marks the start of a prolonged uptrend. Furthermore, VeChain has broken through its key resistance level at $0.051, showing that buyers have taken control and pushed the price higher.


Source: TradingView
What are VET’s technical indicators signaling?
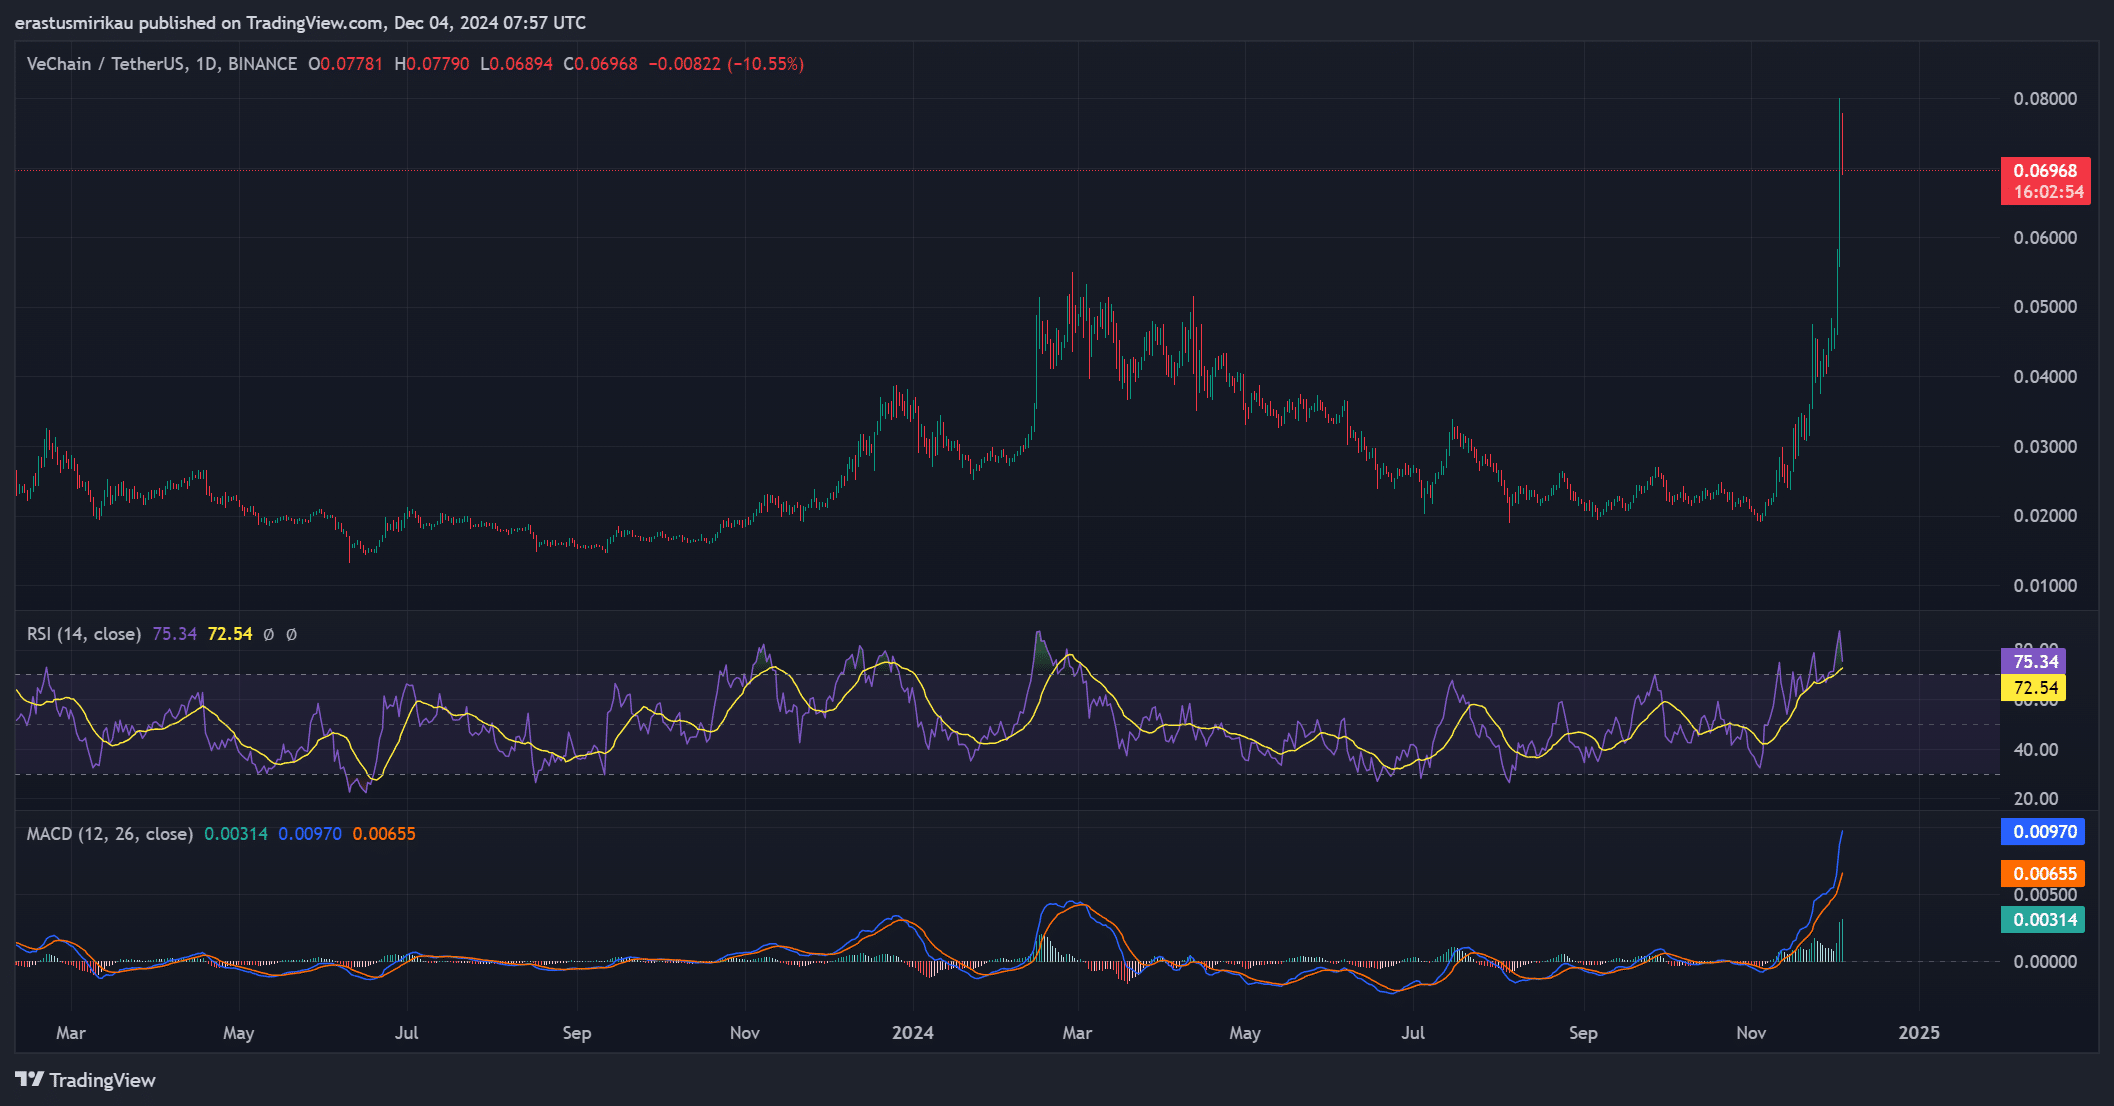
VeChain’s technical indicators show a strong bullish sentiment. The Relative Strength Index (RSI) was at 75.34, suggesting the asset is approaching overbought conditions.
This could indicate a short-term cooling, but since the RSI is still below the 80 threshold, there’s room for further upward movement.
Also, the MACD value of 0.00314 was positive, further confirming bullish sentiment. A positive MACD suggests that buying pressure continues to outweigh selling pressure.
These indicators point to a likely continuation of the current uptrend.


Source: TradingView
Is social volume backing the price surge?
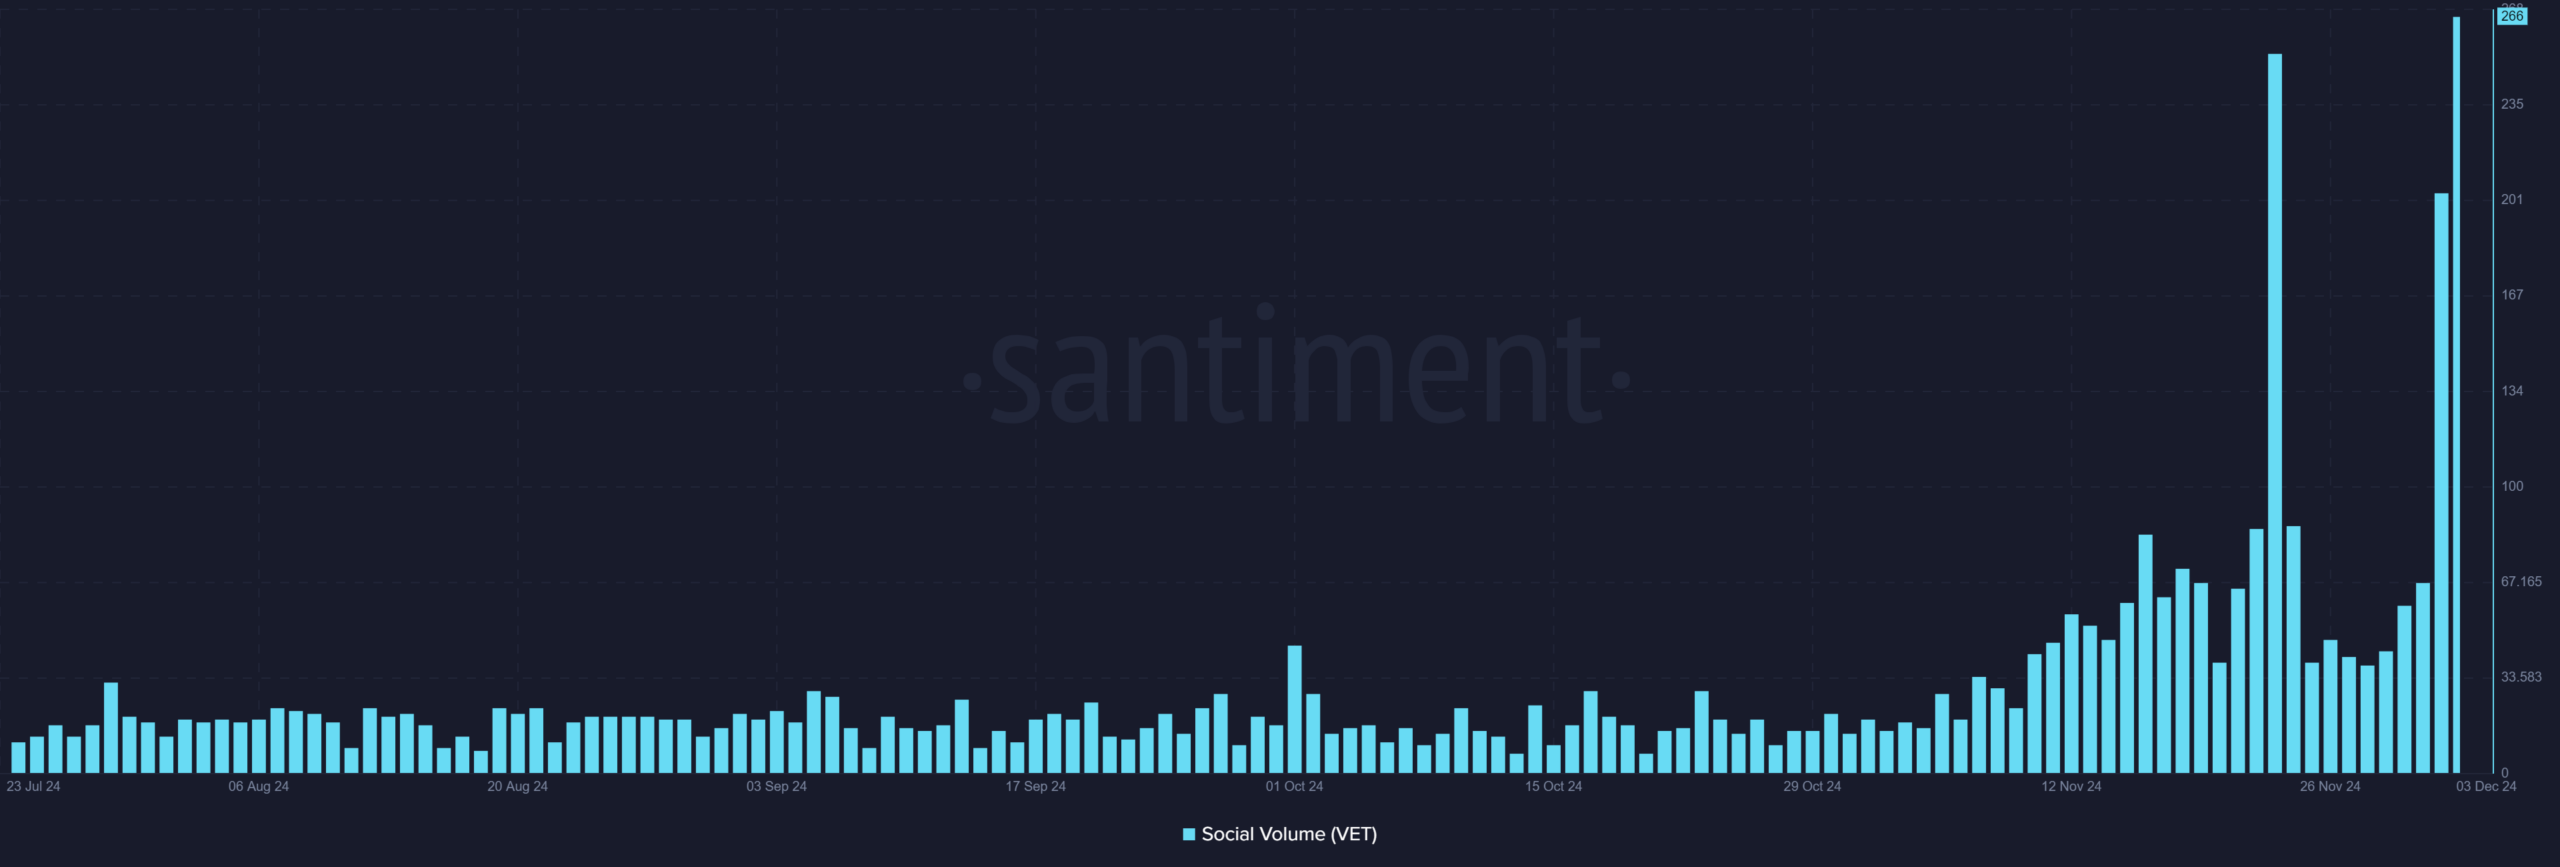
Social volume for VET has increased significantly, rising from 204 to 266 over the past 24 hours. This jump in social activity signals growing interest in VeChain, potentially driving the recent price movement.
Increased social volume often precedes price increases, suggesting that the rally may be fueled by heightened market attention. Consequently, if this trend continues, VeChain could experience further price gains.


Source: Santiment
What does the Long/Short Ratio say ?
The Long/Short Ratio for VeChain stood at 47.03% long and 52.97% short, with a ratio of 0.8879. This indicates a relatively balanced market, with a slight lean towards bearish sentiment.
However, if the bullish momentum continues, short sellers could be caught off guard, potentially leading to a short squeeze that could push the price even higher.


Source: Coinglass
Conclusion: Will VET sustain its bullish trend?
At press time, VeChain’s strong technical indicators, a breakout from key resistance, and rising social volume suggest that the token could continue its upward trajectory.
Read VeChain’s [VET] Price Prediction 2024-25
However, with the RSI nearing overbought levels and a mixed Long/Short ratio, caution is still advised.
If VeChain can maintain its current momentum and hold above key support levels, the outlook remains positive, and we may see further price gains in the coming days.
Source: https://ambcrypto.com/vechain-surges-6-72-in-a-day-can-vet-rally-past-0-07105/