- U.S. trading margin debt surged by $572 billion in October.
- Debt now at an all-time high of $1.2 trillion.
- Implies increased leverage and higher market risks.
In October, U.S. trading margin debt surged by $572 billion, reaching $1.2 trillion. This marks the sixth month of consecutive increases, showing unprecedented leverage levels.
The increase in margin debt highlights excessive risk-taking in markets, surpassing levels from previous financial booms, potentially foreshadowing significant market corrections.
Margin Debt Surge Exceeds Meme Stock Levels
U.S. trading margin debt has surged by $572 billion in October, marking the sixth consecutive monthly increase and surpassing the leverage seen during the 2021 Meme Stock craze. This marks an all-time high of $1.2 trillion. The debt increase amplifies investor leverage, allowing more substantial market positions with less capital, but also signals elevated market risks.
Market implications include the potential for higher volatility as leverage increases the exposure of investors to market fluctuations, which could exacerbate price movements in both traditional securities and cryptocurrencies.
“Margin debt levels are historically elevated just above the 2021 peak indicating massive risk-taking is back, a textbook definition of excessive leverage.”
Branimir Vojcic from Wolf Street cautioned that the current levels even exceed those of the 2000 dot-com bubble, indicating potential market dangers.
Comparative Analysis: Historical Peaks and Present Risks
Did you know? Trading margin debt levels now surpass those during the 2000 dot-com bubble and 2007’s financial peak, historically precursors to major market corrections.
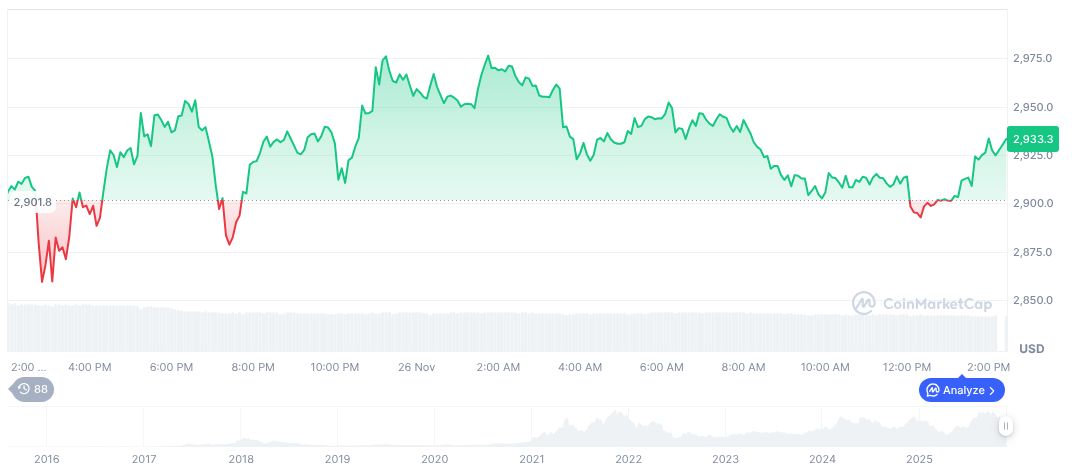
Ethereum’s (ETH) current price stands at $3,051.31, with a market cap of $368.28 billion, according to CoinMarketCap. Notably, ETH has decreased by 31.93% over 90 days. The 24-hour trading volume has fallen by 2.26%, standing at $22.31 billion as of November 27, 2025.
Coincu researchers indicate that elevated leverage in traditional markets could trigger a spillover effect into cryptocurrencies, potentially impacting investor sentiment or influencing market liquidity dynamics. Heightened market risk may lead to increased regulatory scrutiny or calls for stricter leverage controls.
| DISCLAIMER: The information on this website is provided as general market commentary and does not constitute investment advice. We encourage you to do your own research before investing. |
Source: https://coincu.com/markets/us-margin-debt-record-high/
