- Tron’s price set an intraday high of $0.148 today, revisiting May 2021 highs.
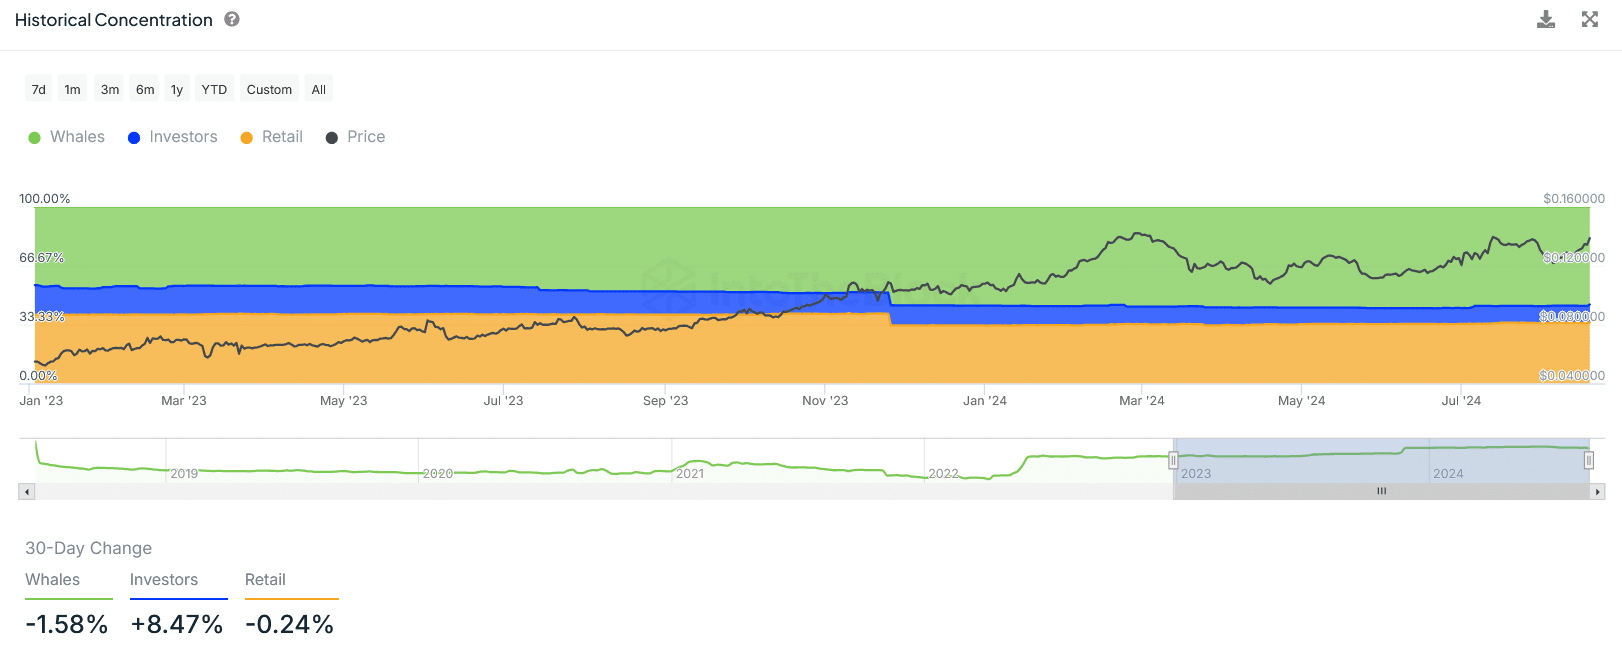
- Tron has a whale concentration of 55.35%, collectively accounting for a supply of 46.86 billion TRX tokens.
Tron [TRX] has been one of the standout alts so far this month, charting a swift price recovery in the aftermath of the stock and crypto market crash on the 5th of August.
TRX’s price dropped below $0.11 at the peak of the market-wide sell-off, which saw Bitcoin [BTC] and Ethereum [ETH] print their steepest daily drops since 2021.

Source: TradingView
While the two have recovered modestly since, TRX has rebounded strongly, gaining 22% in the last two weeks.
TRX’s price rose 6% on the 19th of August, overtaking Cardano [ADA] in market capital rankings.
CoinMarketCap data showed that TRX market capital was up 7.58% in the last 24 hours to $12.9 billion at press time. Meanwhile, its 24-hour trading volume increased by 142% in the same period to $791 million.
Profit-taking concerns
Tron’s impressive spot market action this year has positioned token holders among the most profitable, despite TRX ranging 51% below its January 2018 all-time high.
Nearly 98% of TRX holders are in profit, with the remaining hanging at or near breakeven, according to data from IntoTheBlock analytics platform.
For context, only 65% of Ethereum holders are making money at current prices, while 94% of Polygon [MATIC] holders sit on unrealized losses.
This overwhelming supply of TRX addresses in profit threatens more upside if holders release a significant volume into the market, potentially conceiving selling pressure.
IntoTheBlock’s Tron historical concentration data showed that whales’ cumulative holdings have shrunk by 1.58% in the last 30 days, while retails have dropped 0.24%, suggesting active dumping across the board.

Source: IntoTheBlock
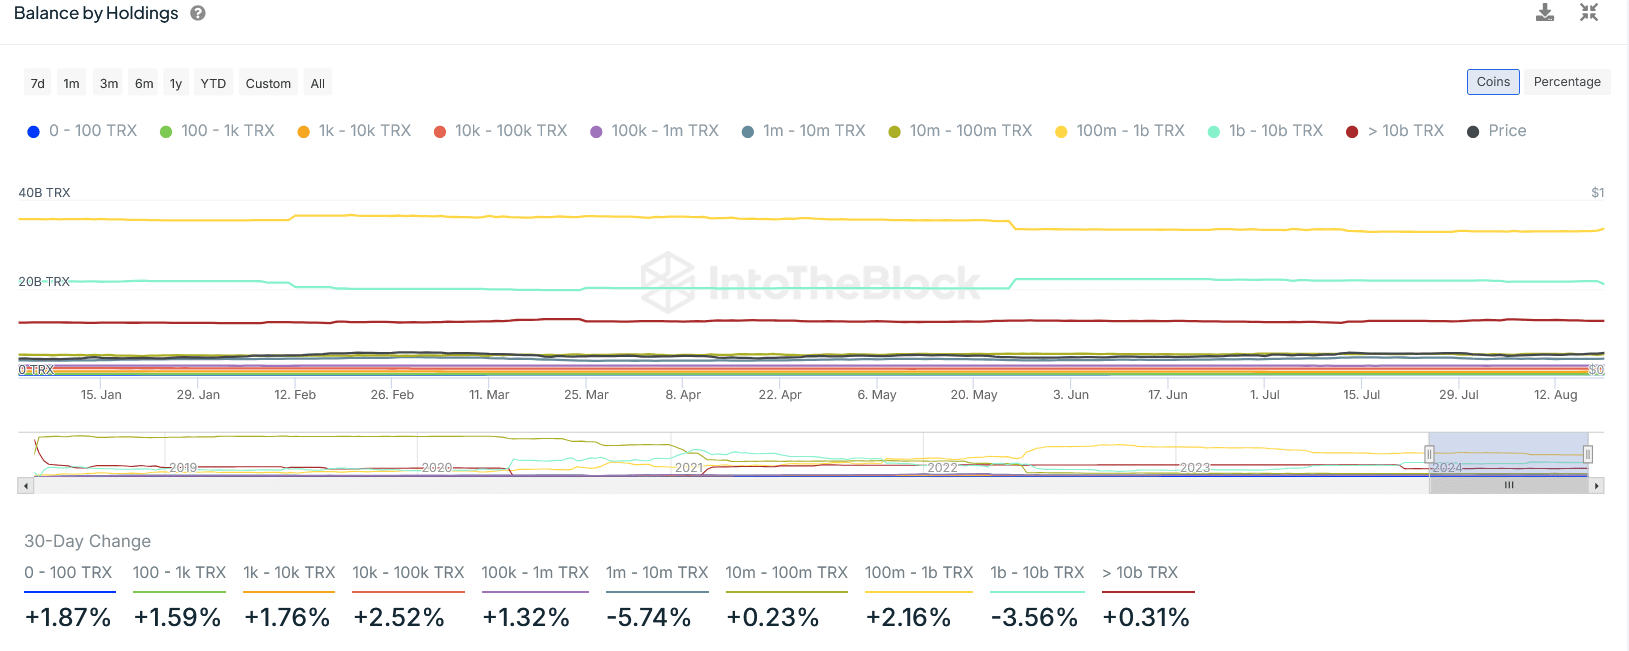
Data on TRX balance by holdings also painted a similar picture. The aggregate amount of crypto held by addresses with 1 million to 10 million TRX tokens has decreased by 5.74% in the last 30 days.

Source: IntoTheBlock
Similarly, the amount of crypto held by addresses with 1 billion to 10 billion TRX tokens has reduced by 3.56% during this period.
Technical analysis
Technical indicators on the TRX price chart flashed bullish signals across multiple timeframes.
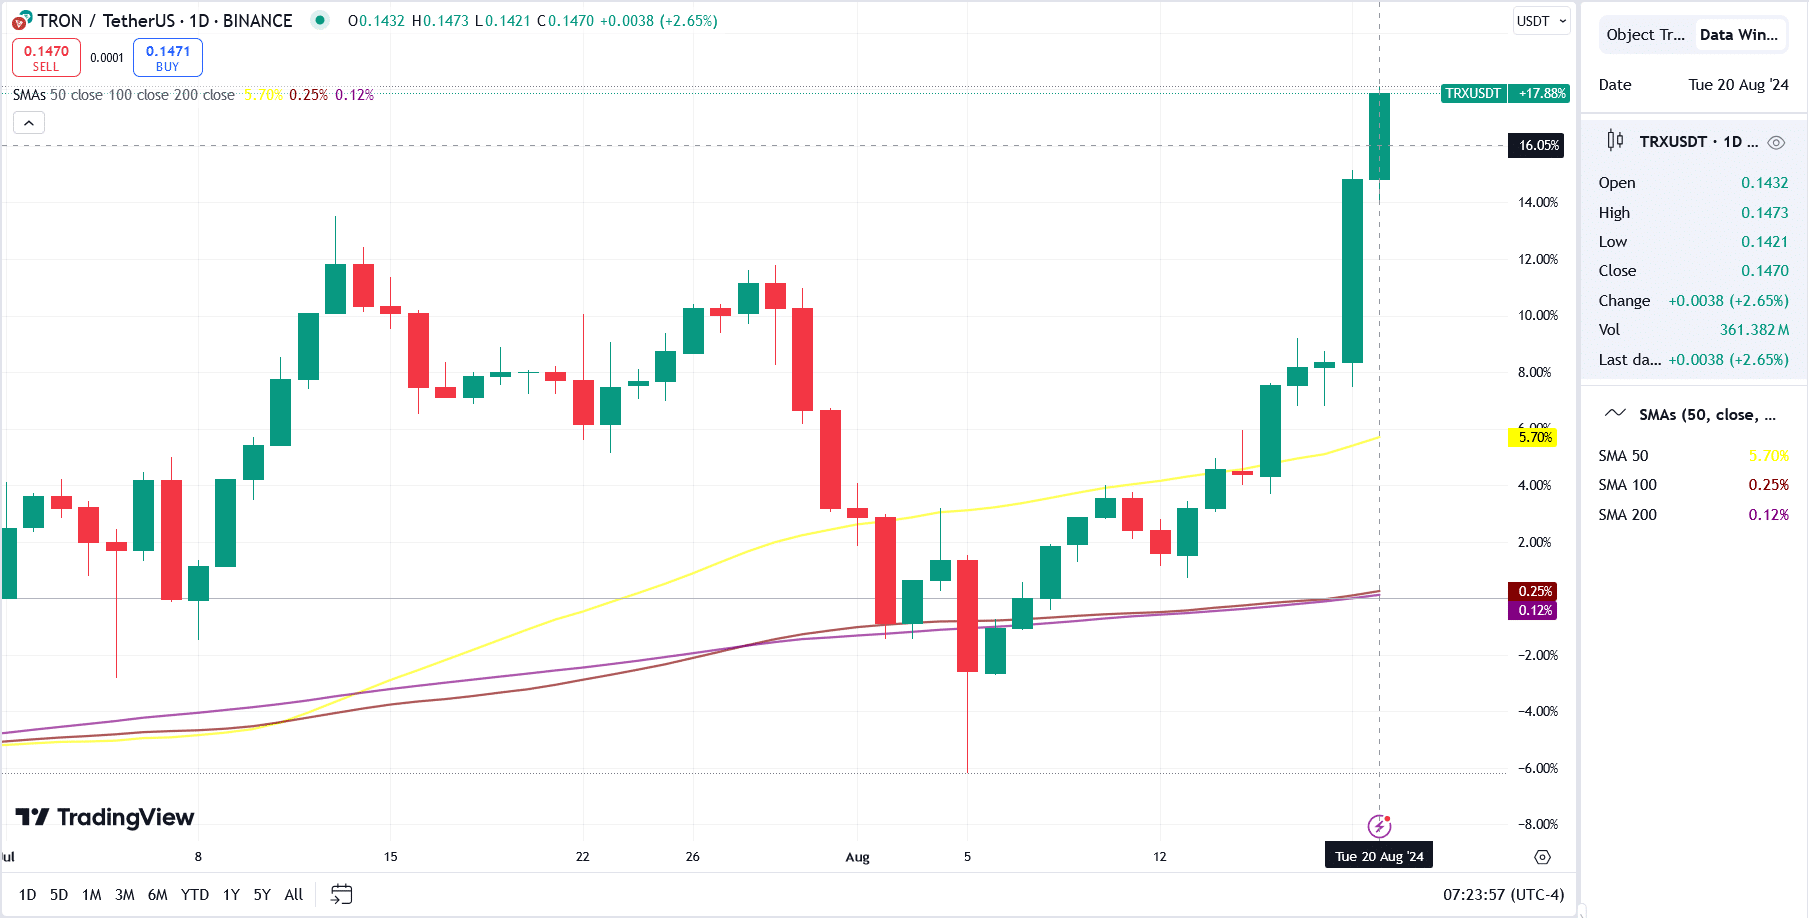
TRX traded above the 20-, 50- and 100-day simple moving averages (SMA) on the 1-hour, 4-hour, and 1-day time frames, signaling a strong uptrend with potential for continued bullish action.

Source: TradingView
Tron (TRX) printed a 6% daily green candle on the 19th of August, breaching $0.14, and has followed up with a developing 2.65% green candle as of press time.
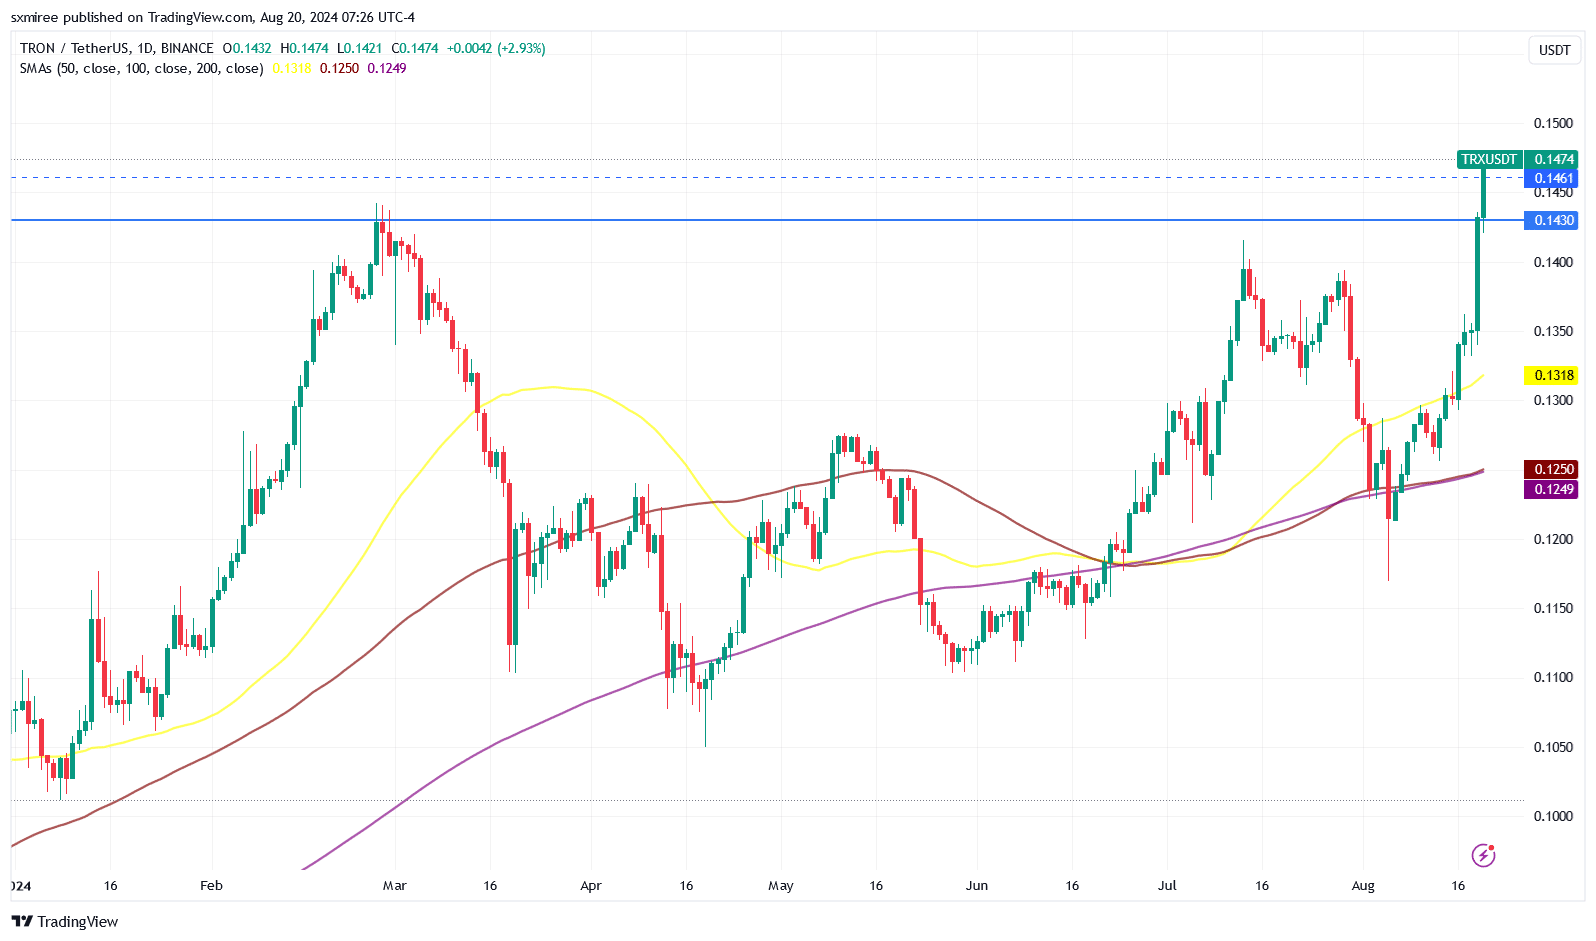
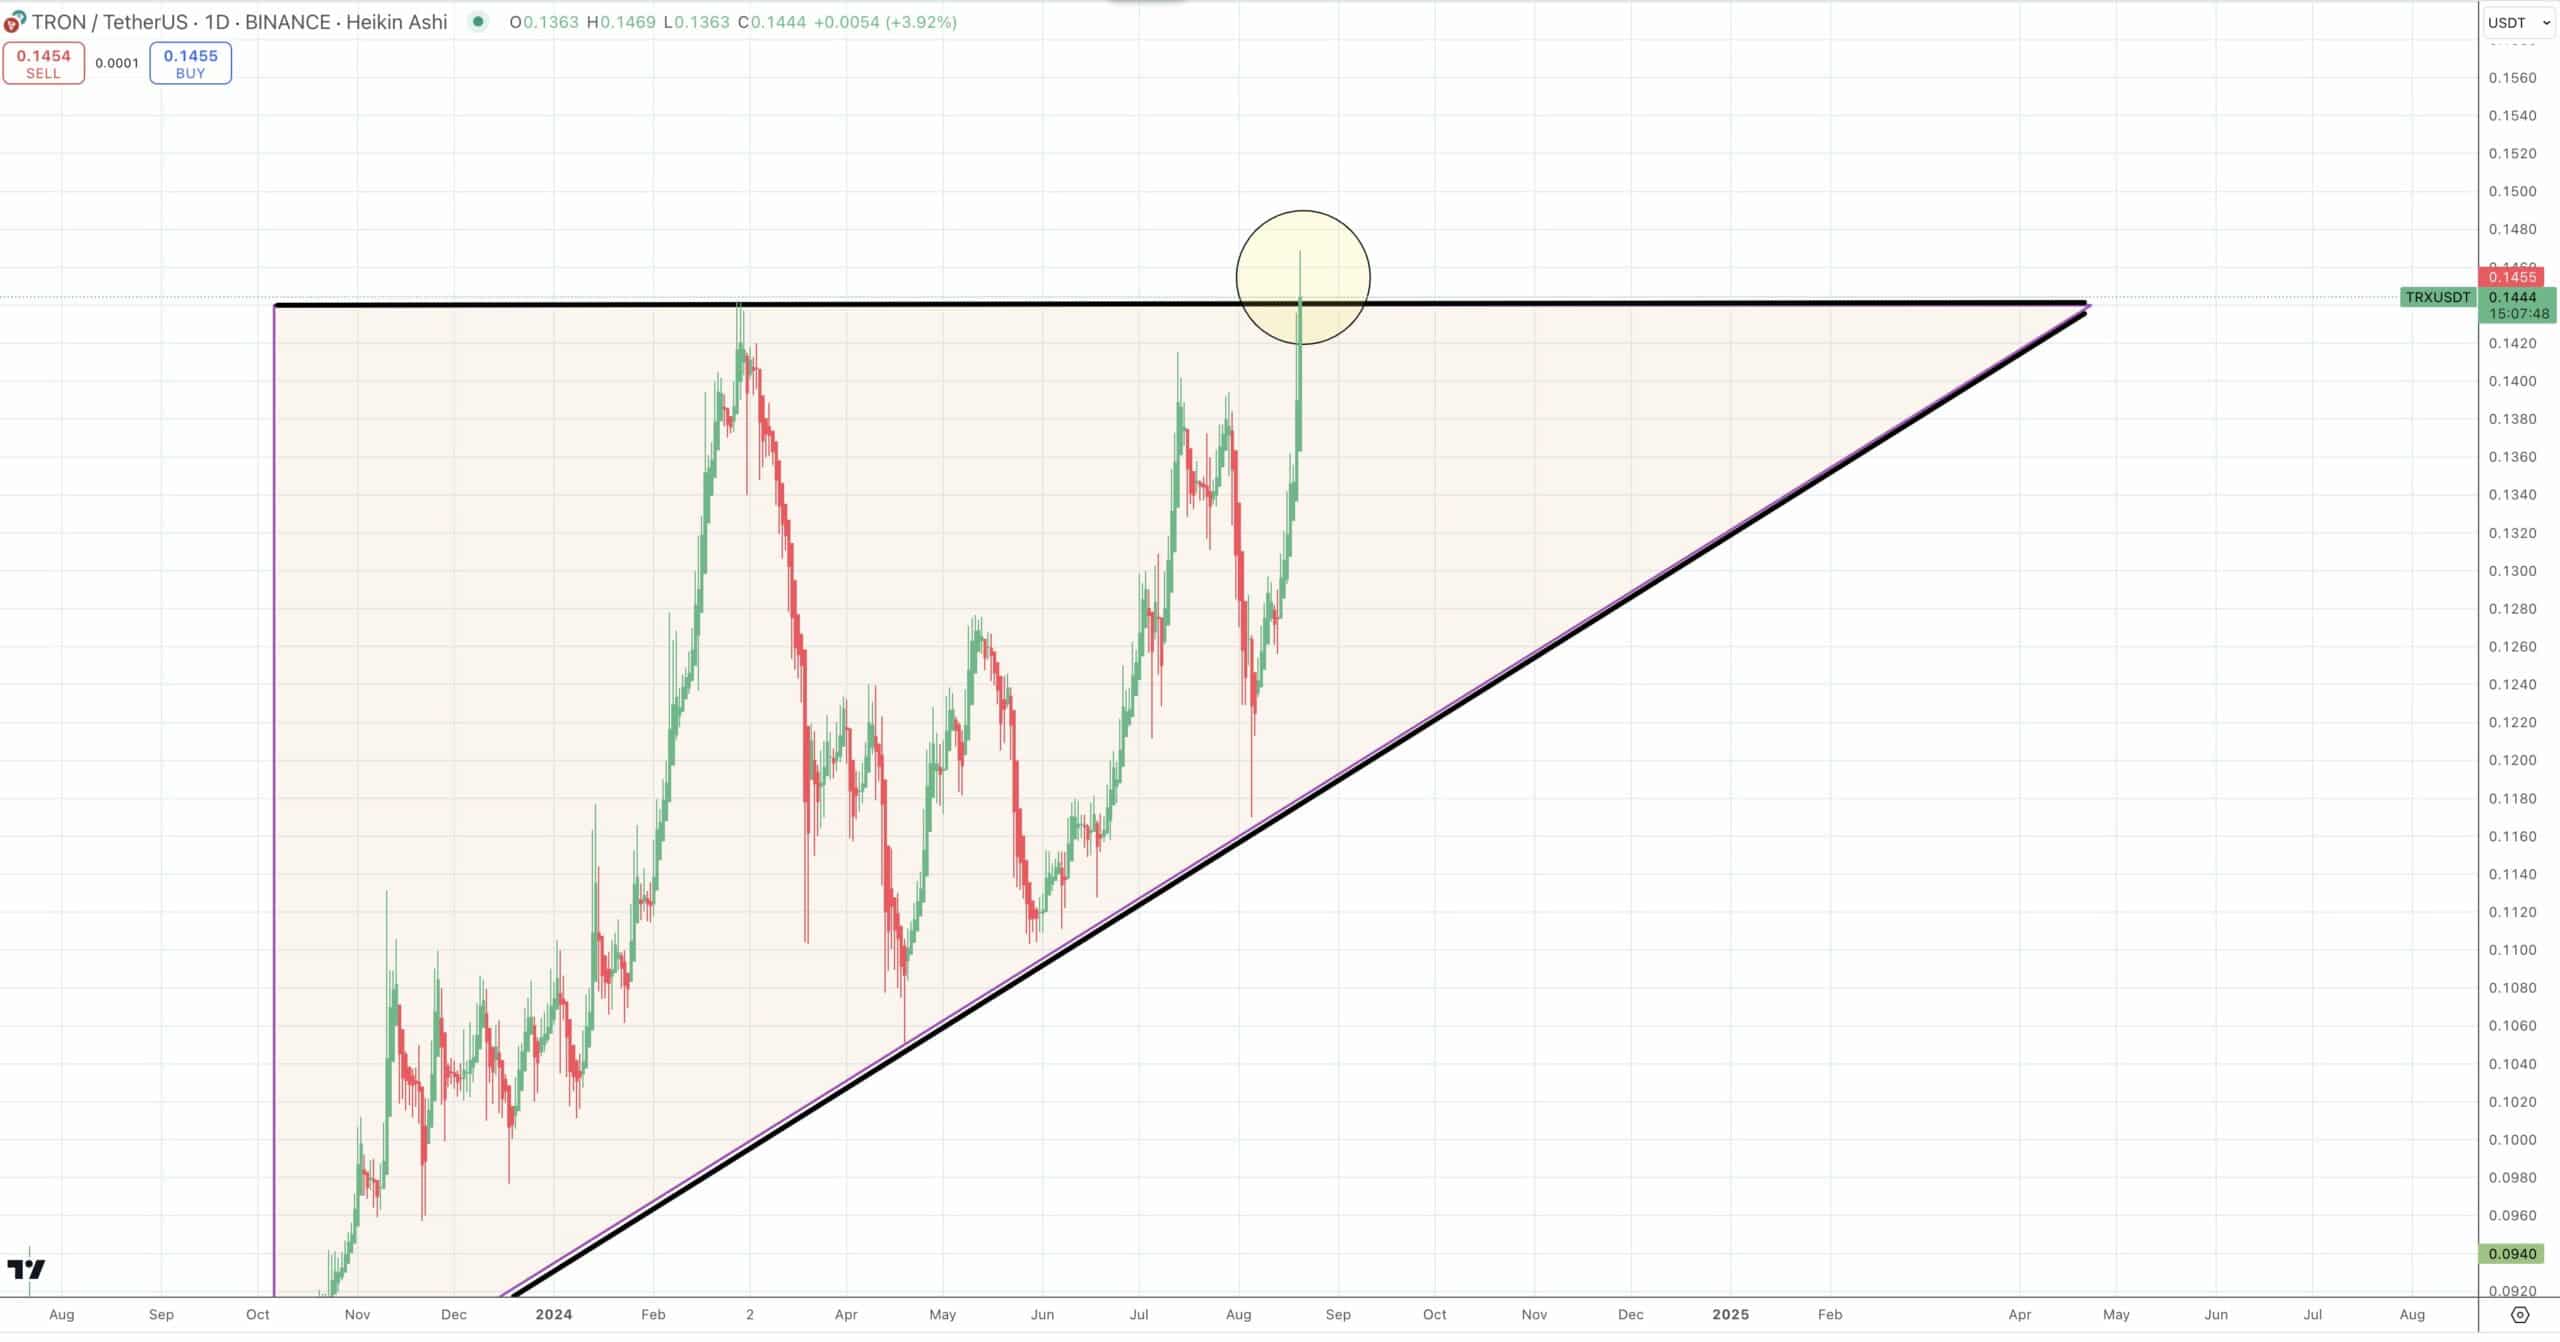
This sustained uptrend has pushed TRX/USDT to overcome the $0.143 resistance, where it has been rejected multiple times before.

Source: TradingView
Realistic or not, here’s TRX market cap in BTC;s terms
A weekly close above this level will strengthen bullish traders’ resolve to flip it into support. On the daily chart, the TRX/USDT pair trades inside a bullish ascending triangle supported by an up-sloping trend line.

Source: X
A continuation of this trend could see TRX claim $0.152 in the near term and challenge $0.155.
Source: https://ambcrypto.com/tron-crosses-2024-high-above-0-148-but-will-whales-turn-trx-bearish/