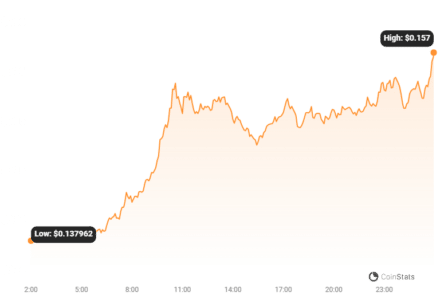
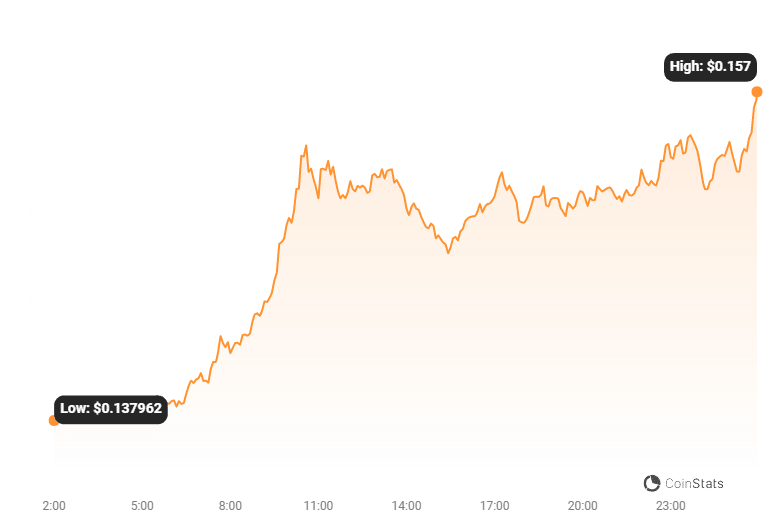
The price of The Graph has increased 9.58% over the past 24 hours to $0.15. Over the past week, GRT has experienced an uptick of over 21.0%, moving from $0.13 to its current price. As it stands right now, the coin’s all-time high is $2.84.
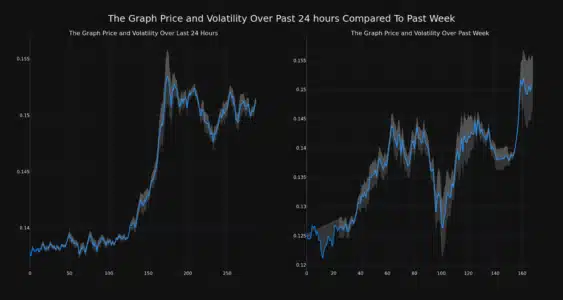
The chart below compares the price movement and volatility for The Graph over the past 24 hours (left) to its price movement over the past week (right). The gray bands are Bollinger Bands, measuring the volatility for both the daily and weekly price movements.
Read Also: NEAR Protocol Up More Than 3% In 24 hours
The wider the bands are, or the larger the gray area is at any given moment, the larger the volatility.

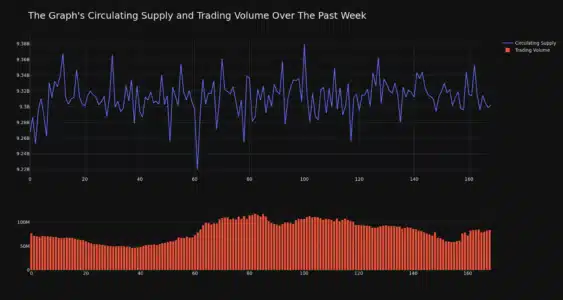
The Graph’s trading volume has climbed 8.0% over the past week, moving in tandem, directionally, with the overall circulating supply of the coin, which has increased 0.38%. This brings the circulating supply to 9.31 billion. According to our data, the current market cap ranking for GRT is #47 at $1.41 billion.

Disclaimer: The information provided is not trading advice. Bitcoinworld.co.in holds no liability for any investments made based on the information provided on this page. We strongly recommend independent research and/or consultation with a qualified professional before making any investment decisions.
Source: https://bitcoinworld.co.in/the-graph-rises-more-than-9-in-24-hours/