- Spot gold breaks the $4,200/oz mark with economic impacts.
- Gold’s rise influences crypto hedge narratives.
- Fed’s policy stance is pivotal to market adjustments.
Spot gold surpassed $4,200 per ounce on October 15, 2025, marking a new all-time high driven by expectations of U.S. Federal Reserve rate cuts and trade tensions.
This milestone affects global markets, particularly impacting cryptocurrencies like Bitcoin and Ethereum as traders seek alternative hedges amidst macroeconomic uncertainty.
Gold Surges Over $4,200/oz Amid Fed’s Flexible Stance
Gold’s ascent past $4,200/oz marks a historic achievement, driven by expectations of potential U.S. Federal Reserve policy shifts. Economic variables, including trade tensions, heavily influenced this rise. Jerome Powell, chair of the Federal Reserve, emphasized policy adaptability. Spot gold experienced an increase of nearly 1.4% intraday, indicating ongoing confidence.
Gold’s leap suggests a strategic shift among investors towards traditional safe-haven assets, amid macroeconomic uncertainties. The rise emphasizes a cautious approach in equity and bond investments.
“The Fed stands ready to adjust policy to address risks as they evolve.” — Jerome Powell, Chairman, U.S. Federal Reserve
Bitcoin Rallies Slightly as Gold’s Price Sets New Record
Did you know? Gold’s climb past $4,200/oz mirrors historical patterns where previous peaks led to temporary rallies in cryptocurrencies like Bitcoin and Ethereum during times of economic uncertainty.
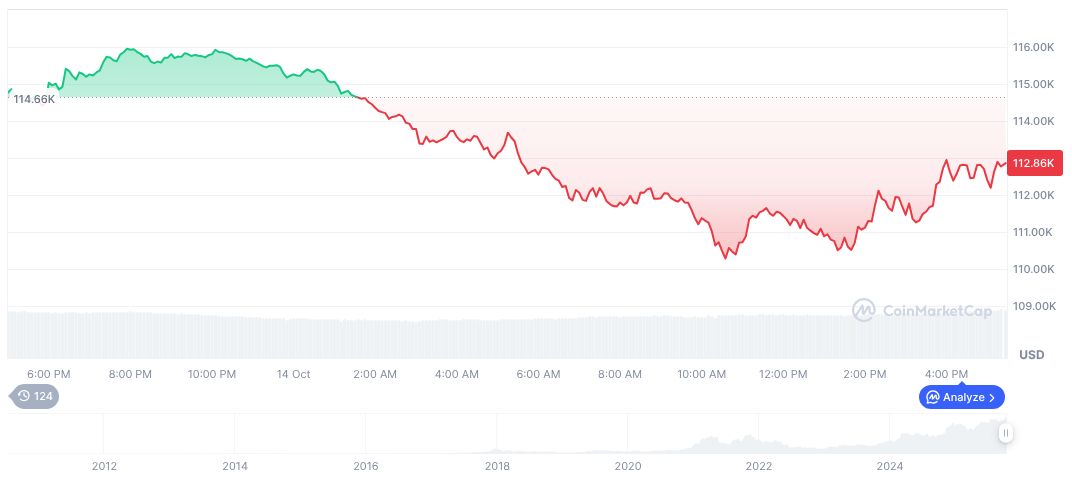
Bitcoin (BTC) currently trades at $112,585.79 with a market cap of formatNumber(2244330750552.37, 2). BTC’s market dominance stands at 58.54%, showing a slight 24-hour price increase of 0.82%. Trading activity figures, notably the 24-hour volume of formatNumber(85459980695.64, 2), reflect responsive market behaviors. Data from CoinMarketCap suggests moderate fluctuations, consistent with broader macroeconomic narratives.
Coincu’s research team finds that historically, gold’s price movements potentially predict trajectories for BTC and ETH, especially during trade tensions. Such contexts prompt shifts towards digital asset hedges, reaffirming cryptocurrencies’ roles in evolving market hedging strategies.
| DISCLAIMER: The information on this website is provided as general market commentary and does not constitute investment advice. We encourage you to do your own research before investing. |
Source: https://coincu.com/markets/spot-gold-surges-us-fed-flexibility/
